

To say something moves at a glacial pace is to imply sluggish, unhurried change. But what transpired over the course of 15 months at Antarctica’s Hektoria Glacier was uncharacteristically quick. Between January 2022 and March 2023, the glacier lost about 25 kilometers (15 miles) in length. That included a two-month period in which the terminus retreated more than 8 kilometers (5 miles)—the highest rate of grounded glacial ice loss observed in modern history.

A team of scientists published an analysis of Hektoria’s collapse based on a suite of remote-sensing data, finding that its particular geometry enabled the rapid change. Like many glaciers on the Antarctic Peninsula, Hektoria starts on land and extends to the sea, with the last section being a thick, floating plate of ice, or “ice tongue.” The researchers determined Hektoria lost both its ice tongue and an area of grounded ice spread over a flat plain—the latter directly contributing to sea level rise. Although Hektoria is relatively small as Antarctic glaciers go, scientists say that similar events at larger glaciers could be much more consequential.
The images above capture the scale of the loss of Hektoria’s grounded ice on the eastern Antarctic Peninsula. Note that the right image was acquired about one year after the remarkable loss of grounded ice; a cloud-free Landsat image showing the whole area was not available from the previous March. Hektoria’s terminus remained relatively stable after the sudden loss, the study reported, though the neighboring Green Glacier continued to retreat.
The chain of events culminating in Hektoria’s breakup goes back to early 2002. At that time, the Larsen B ice shelf, which served as a backstop for Hektoria and neighboring glaciers, splintered and collapsed in short order. The glaciers then thinned and retreated for several years. In 2011, landfast sea ice in the Larsen B embayment near Hektoria’s terminus filled in enough to allow the glacier to start advancing.
But after several years, the new support for the glacier front was suddenly removed. Landfast ice in the embayment broke up in January 2022, likely due to large, destabilizing ocean swells. From that point, rapid change at Hektoria was again underway. Throughout the rest of the austral summer, the floating ice tongue disaggregated in a series of calvings, resulting in a loss of 16 kilometers.
The glacier’s terminus stabilized during the 2022 austral winter. However, satellite-based laser altimetry data, including ice elevation measurements from NASA’s ICESat-2 (Ice, Cloud, and Land Elevation Satellite-2) mission, revealed that the ice continued to thin during that winter.
The thinner remaining ice was still grounded during the 2022 austral spring (left image, above), the study authors concluded, based on the detection of earthquakes occurring beneath the glacier. They determined the ice was spread out over a relatively flat area of bedrock, forming an ice plain. This geometry allows seawater to infiltrate the glacier’s bed during high tide and intermittently lift ice off the ground. When ice is thin enough, large areas can lift and break away at once. The process, called buoyancy-driven calving, is believed to have caused the second stage of Hektoria’s rapid retreat, resulting in an additional loss of 8 kilometers in length.
Naomi Ochwat, a glaciologist at the University of Innsbruck and the study’s lead author, is now looking into other glaciers that may be at risk of destabilizing in a similar way. As the Antarctic Peninsula responds to warming, more of its glaciers are losing their ice tongues, and their termini are now resting on the seabed, as Hektoria's does. (Called tidewater glaciers, this type is common in Alaska and Greenland.) New technologies developed by NASA and partners can aid in understanding rapid glacial retreat, said Ochwat and study co-author Ted Scambos, a senior research scientist at the University of Colorado Boulder.
The NISAR (NASA-ISRO Synthetic Aperture Radar) satellite, for example, can detect the movement of land and ice surfaces down to the centimeter. Its data will be “very useful for structural evaluations of Hektoria and other glaciers in the region,” Scambos said.
“In addition to NISAR,” Ochwat added, “I'm particularly interested in learning what SWOT can tell us about rapid glacier changes.” The SWOT (Surface Water and Ocean Topography) satellite’s primary mission is to observe the fine details of Earth’s surface water height. But scientists are also exploring its applications to the cryosphere, such as measuring surfaces of ice shelves and sea ice.
At Hektoria Glacier, the days of dramatic change are likely past, now to be replaced by slow retreat. Scambos said he would not be surprised to see the ice slowing down. “The glacier has lost so much elevation and mass that it simply can’t continue to maintain the same output,” he said. “It’s on its way to being a fjord, not a glacier.”
NASA Earth Observatory images by Lauren Dauphin, using Landsat data from the U.S. Geological Survey. Story by Lindsey Doermann.
Design by Tom Prater and Kerry Cleaver
The Atlantic Meridional Overturning Circulation (AMOC) is a vast system of ocean currents that helps to distribute heat around the world.
By transporting warm water from the tropics northwards and cold water back southwards, the AMOC keeps Europe warm and plays a role in controlling global rainfall.
It connects into an even larger network of ocean currents that continuously moves water, nutrients and carbon around the world.
Now, the AMOC is under threat from human-caused climate change, as warming seas, melting ice and increased rainfall upset the temperature and salt balance of the North Atlantic.
Scientists have warned that the ocean currents are slowing down – and could eventually become so frail that they no longer transport heat around the globe.
A growing body of research has suggested that, with enough warming, the AMOC could reach a “tipping point” and transition to a weak state for many centuries.
The Intergovernmental Panel on Climate Change (IPCC) has projected that the AMOC will decline over the course of the 21st century as the world warms.
However, whether – and when – currents might “collapse” remains a subject of debate.
The IPCC says a “collapse” before 2100 is unlikely.
However, some scientists have argued climate change could force the AMOC past a “point of no return” over the coming decades that could usher it towards a “shutdown” next century.
A major slowdown or “tipping” of the AMOC could have grave consequences for European temperatures, causing them to plunge – despite global warming.
It could also affect global food supply, sea level rise and global rainfall patterns, or even act as a catalyst that sets off a series of other catastrophic climate “tipping points”.
Below, Carbon Brief explains what the AMOC is and how it is being impacted by climate change.
The article also explores scientific debates around the future of the AMOC, including what the latest research says about the possibility and consequences of a collapse of the ocean currents.
The AMOC is a system of ocean currents driven by variations in seawater density controlled by temperature (“thermo”) and salinity (“haline”). This makes it a “thermohaline circulation”.

Winds also play an important role in powering the AMOC, helping to propel surface currents and draw dense, nutrient-rich water from the ocean’s depths to its top layer.
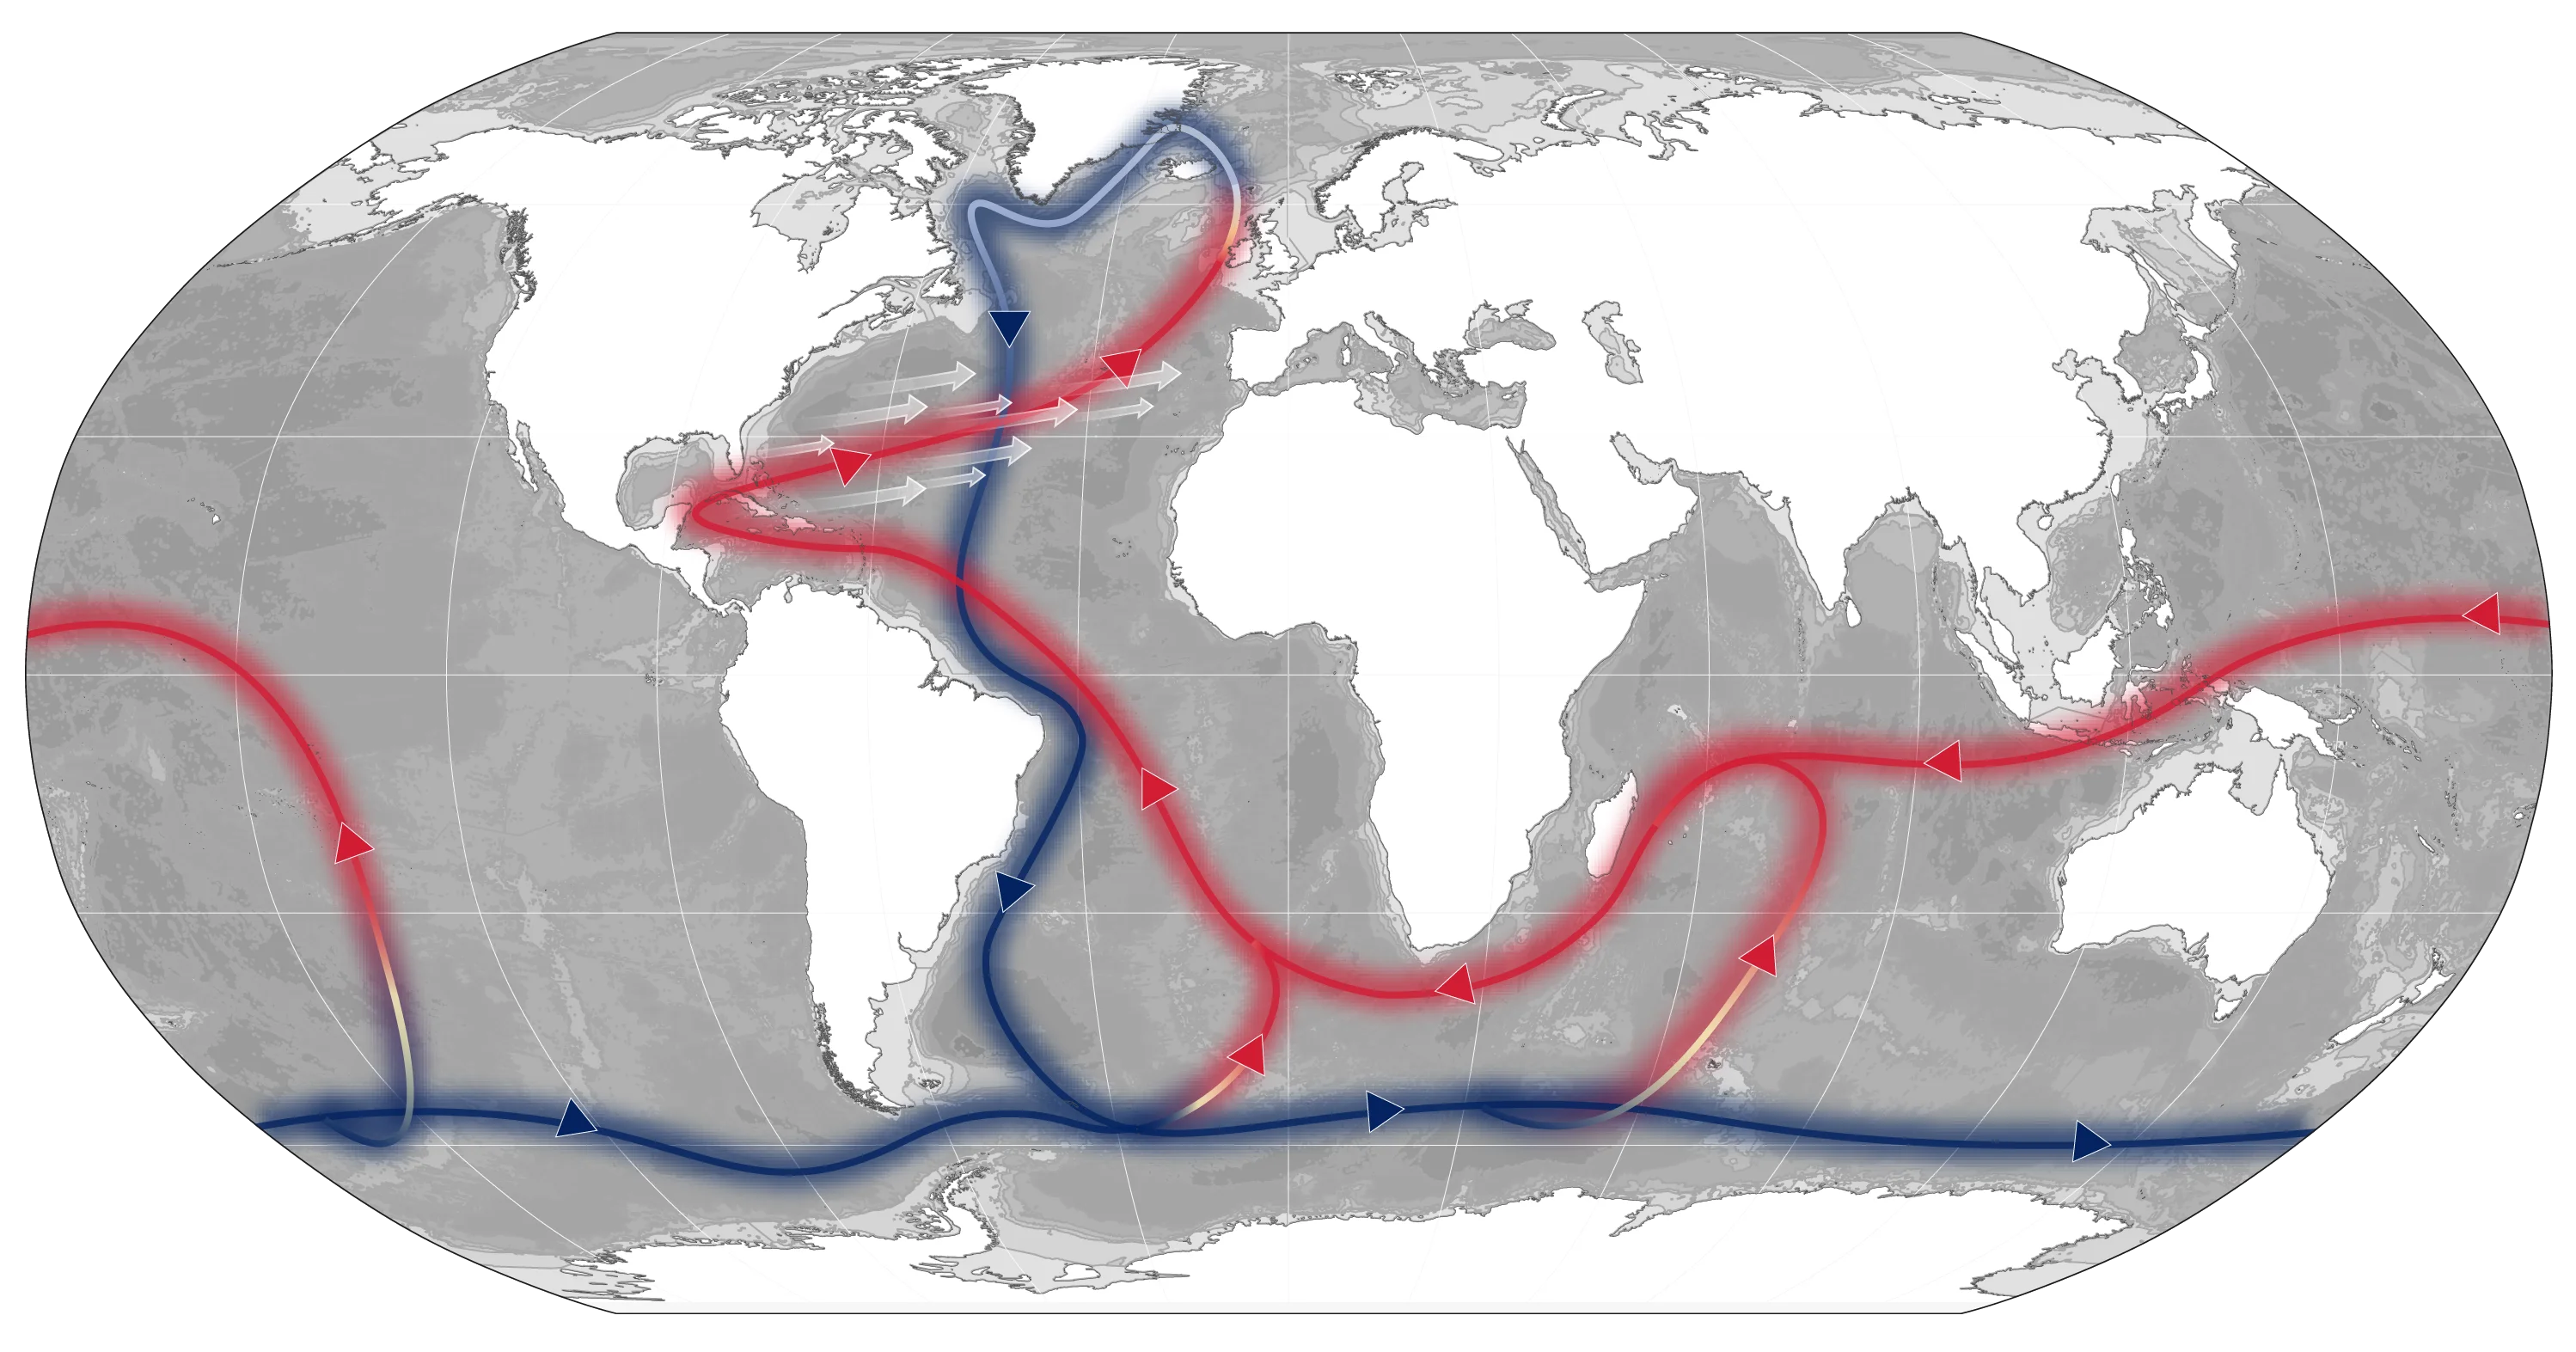
The AMOC connects into a broader circuit of slow-moving currents – the global thermohaline circulation – that transports heat and nutrients around the world. This system is sometimes described as the “ocean conveyor belt”.
In the high latitudes of the North Atlantic, warm surface water is cooled by the overlying atmosphere. As water evaporates and sea ice forms, salt is left behind in the ocean. As a result, the surface water sinks.

The water then heads south, thousands of metres below the ocean’s surface.

Outside of the Atlantic, this cold water is pulled back to the surface, assisted by ocean mixing and winds in the Southern Ocean. This is known as “upwelling”.

Upon returning to the North Atlantic, warm, salty water in the tropics is then pulled northwards towards Europe, closing the loop.

Upwelling, which occurs in different parts of the Southern, Indian and Pacific oceans, is not technically part of the AMOC, which refers to the northward flow of warm, surface water and southward flow of cold, deep water specifically within the Atlantic Ocean. Nevertheless, it is crucial to the functioning of the AMOC.

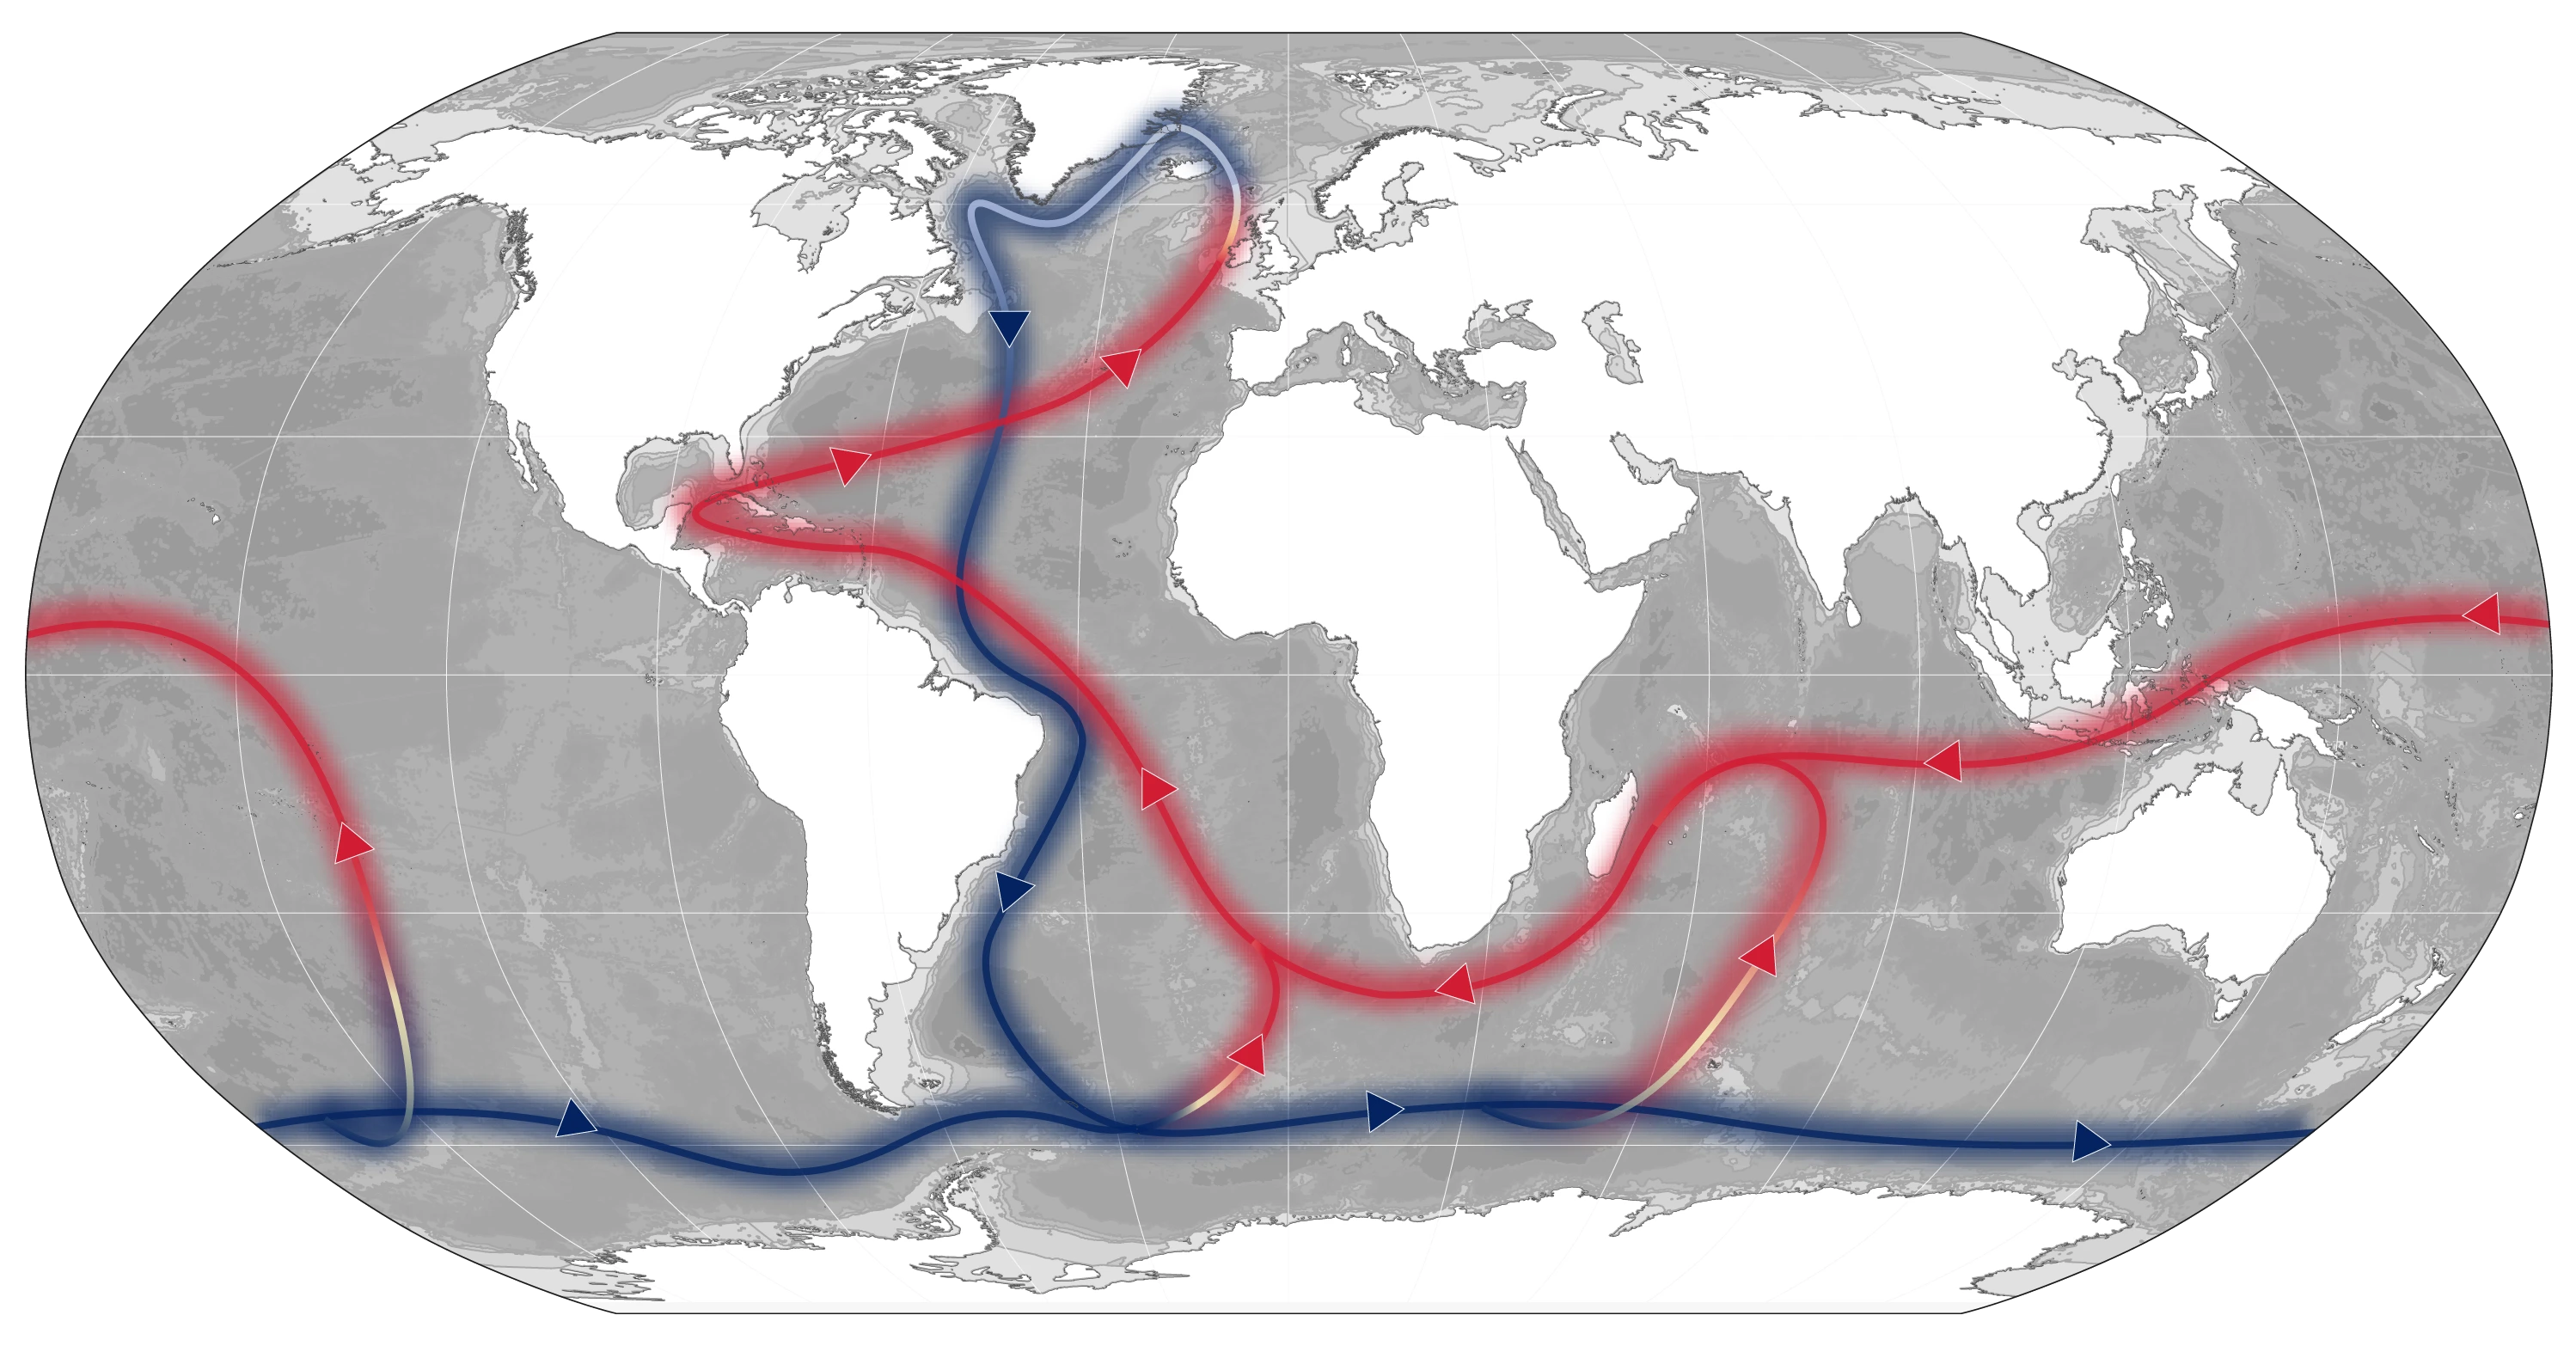
It has been estimated that it takes hundreds to thousands of years for a “parcel” of water to make a journey around the globe before returning to the equator in the North Atlantic. (The exact timeframe depends on the route it takes, according to a 2021 Science Advances study.)

The speed of water transportation picks up dramatically in the “upper branch” of the AMOC, as surface water hurtles northward from the equator to the poles, powered by winds.
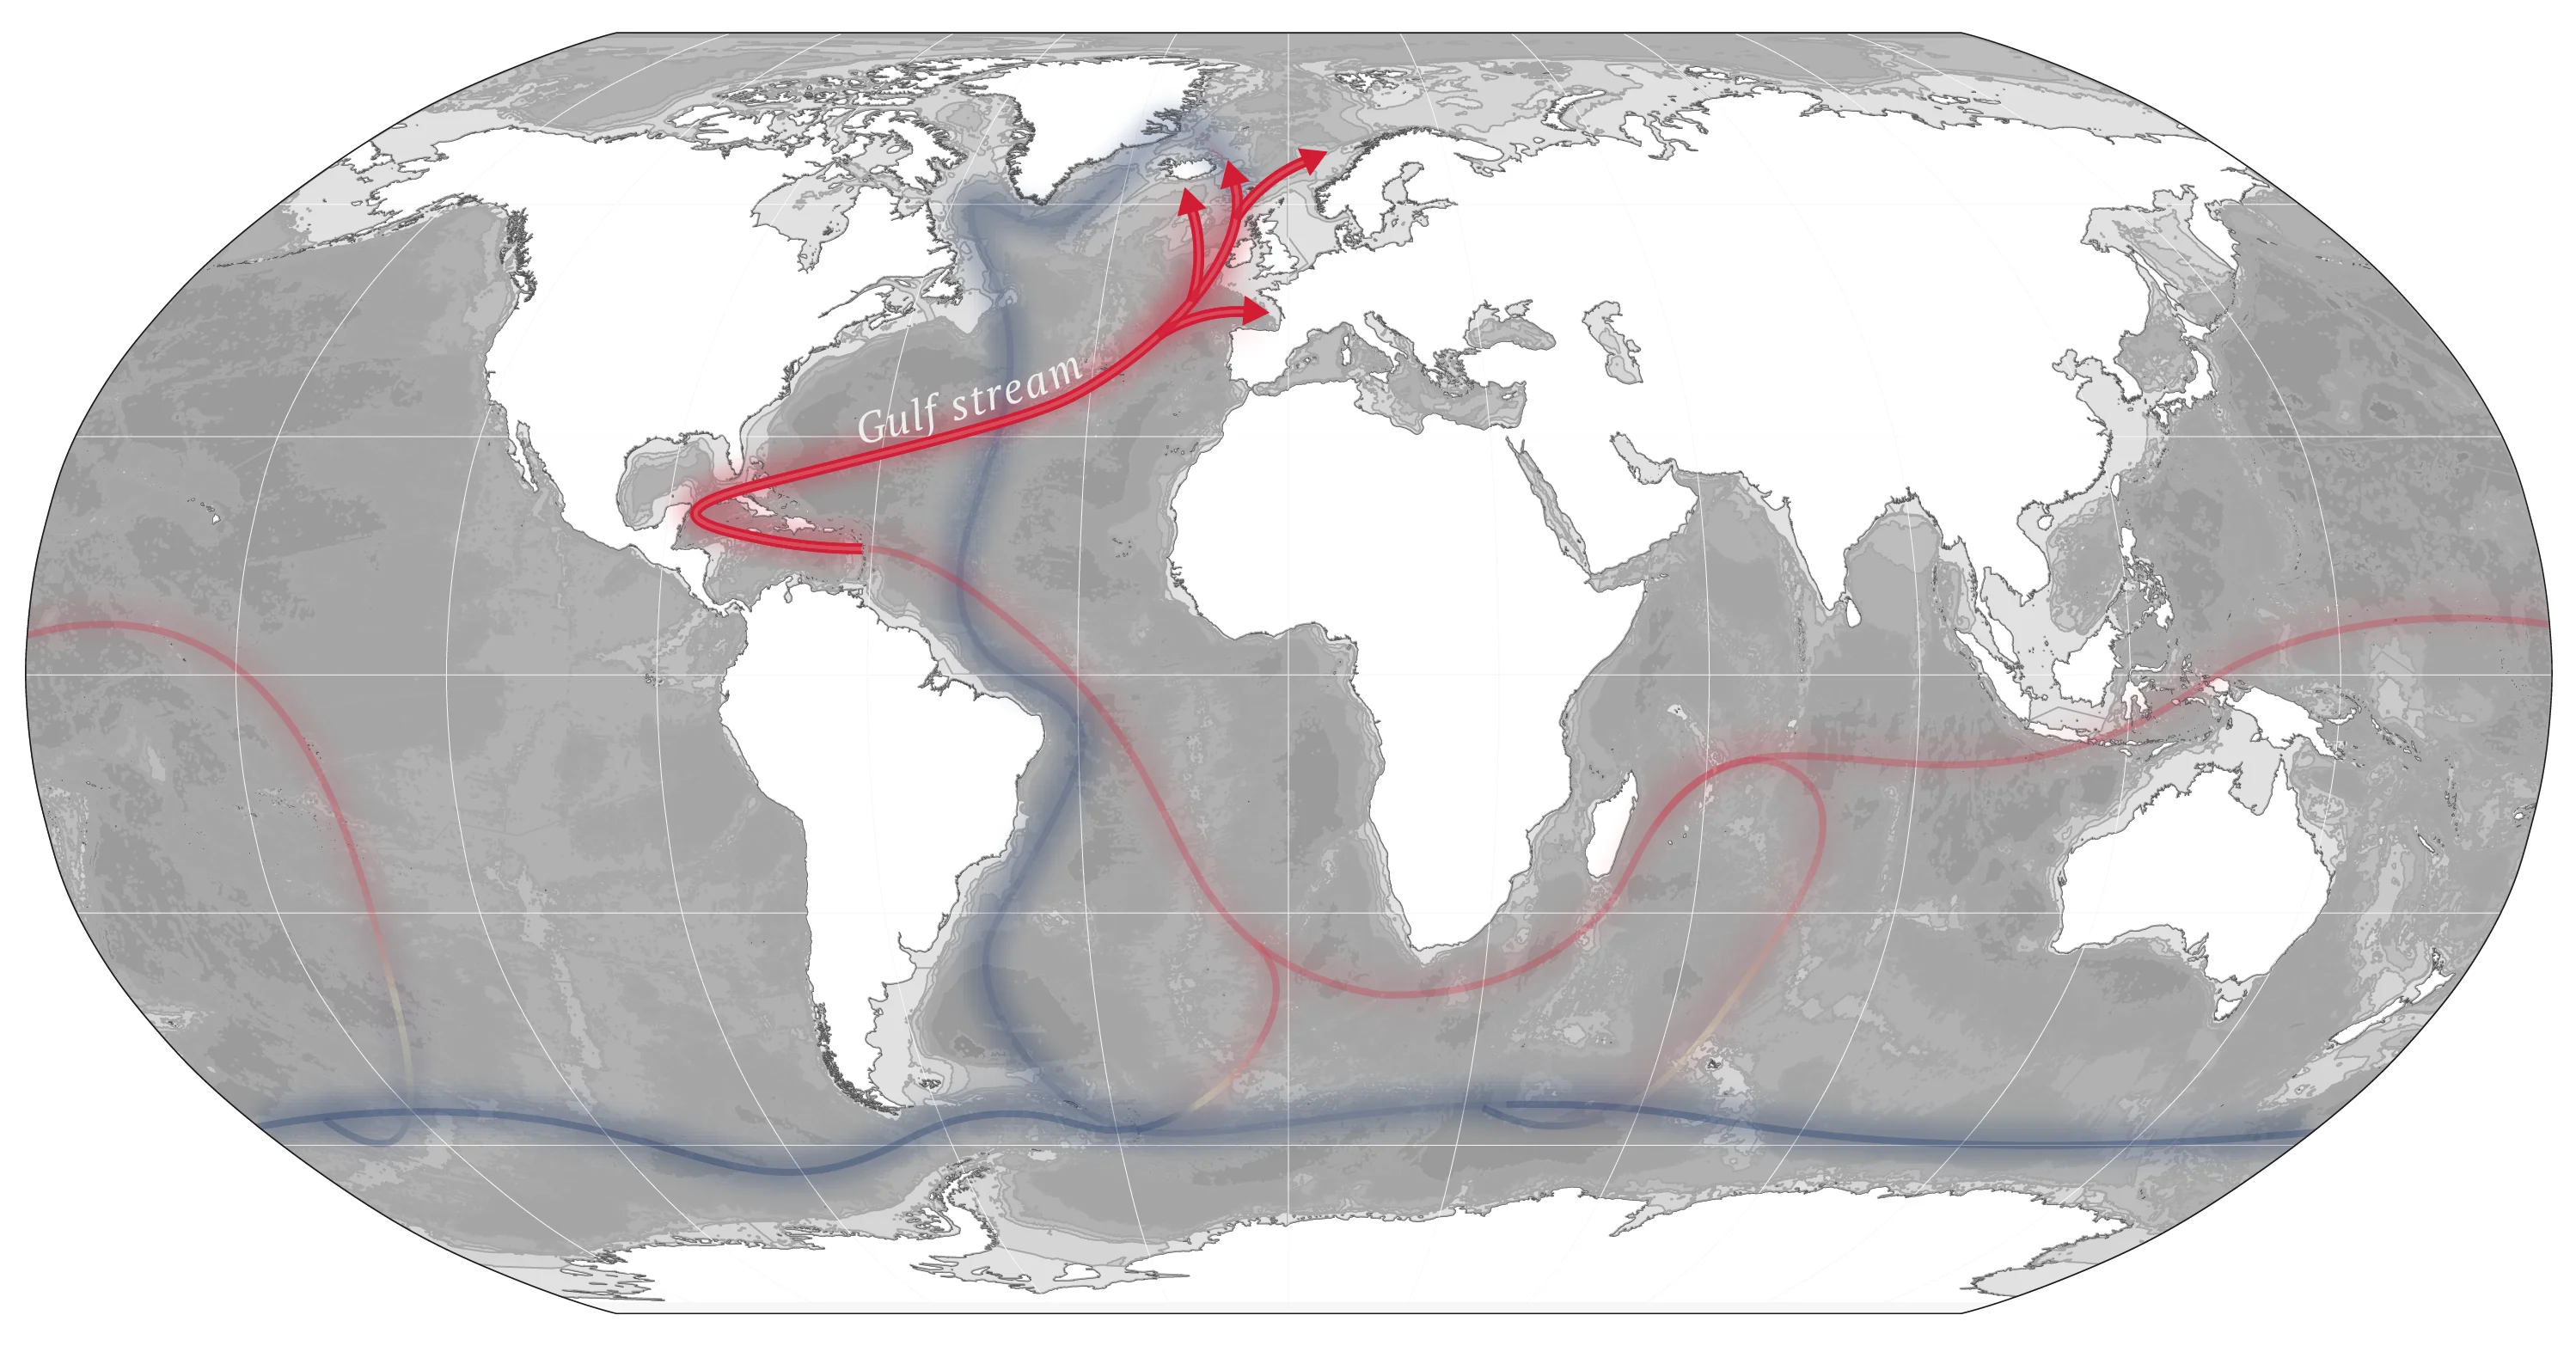
The Gulf Stream – a key AMOC component that runs from the Gulf of Mexico to northern Europe and is primarily driven by winds – is one of the fastest ocean currents, reaching peak velocities of 2-2.5 metres per second.
The AMOC does not only transport heat. It also plays a role in the transportation of nutrients that support marine ecosystems, as well as supporting the carbon cycle by transporting carbon-rich surface waters to the deep ocean.
Since the mid-20th century, oceanographers have warned that a warming climate could cause a slowdown of the AMOC, with far-reaching consequences for global weather patterns, humans, biodiversity and the carbon cycle. (For more, see: What are the projected impacts of AMOC collapse?)
The warming of the atmosphere due to the rise in greenhouse gases is causing an influx of freshwater into the North Atlantic from melting ice from Greenland.
Human-caused climate change has also been linked to an overall intensification of the global water cycle, meaning that more rainfall and more run-off from rivers ends up in the ocean.
Together, these factors are reducing the saltiness of water in the North Atlantic.
Sea surface temperatures are also rising with climate change.
When water is warmer and less salty, it sinks less easily. This hinders the “deep-water formation” – the process of cold water sinking – in the North Atlantic, slowing down the AMOC.
This has a compounding effect. As the AMOC slows down due to an overload of freshwater, it is able to transport less salty water northwards from the tropics – making the North Atlantic even more diluted. This is known as the salt-advection, or salinity-advection, feedback.
Against this backdrop, warmer air temperatures in the North Atlantic are reducing the ocean waters’ ability to shed heat at the surface and sink – further incapacitating the AMOC.
Experts have sounded the alarm that, with enough warming, the AMOC could weaken to a point where it is no longer able to transport heat and salt around the Atlantic.
A growing number of scientists believe the AMOC could eventually transition into a weak state from which it would not be able to return for centuries – even if warming were reversed.
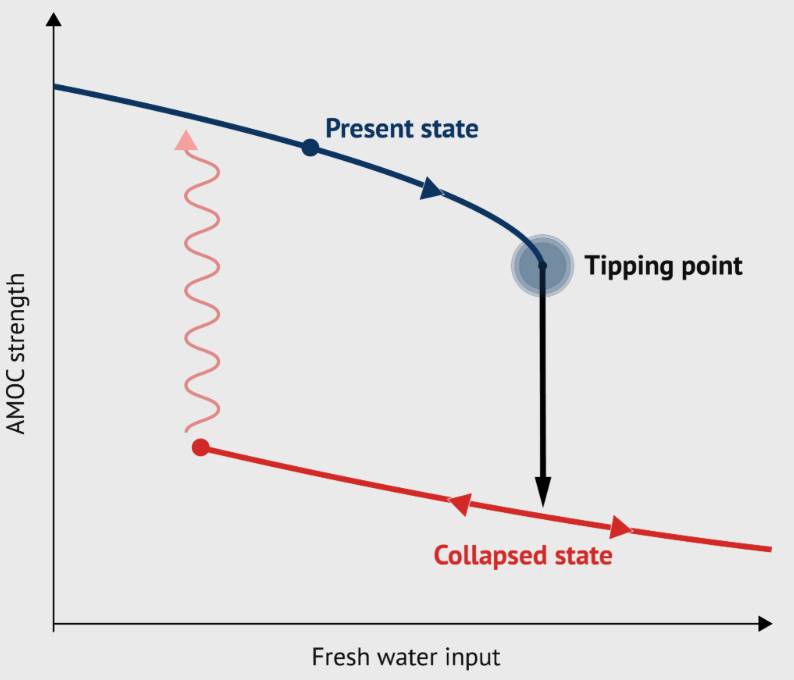
This makes the AMOC an example of a climate “tipping” element – a part of the Earth’s system that has the potential to dramatically shift once pushed past a specific threshold by human-caused warming – often irreversibly.
US oceanographer Henry Stommel was the first scientist to propose that the AMOC could transition to a much weaker state.
In a 1961 paper, he used a simple model to propose that a thermohaline system could exist in two “stable regimes of flow”.
Stommel suggested that if a thermohaline system was subjected to enough changes in water density – in other words, was diluted with enough freshwater...

...it would collapse into a “new regime”.

Once in this new, weaker state, the system would not be able to simply return to the previous regime, even if conditions returned to their original state.

This is known as “bistability” – the potential of a system to have two different “stable” states. Once the system has been pushed into a different state, it cannot easily be pulled back again.
The bistability of the AMOC has been demonstrated in the years since Stommel’s model in modern climate models of increasing complexity.
A 2026 review study said the “evidence base in favour” of AMOC’s bistability had “broadened over the last years” – and concluded that the present-day AMOC was “in such a regime”.
There is broad consensus that evidence suggests the AMOC has exhibited bistable behaviour in previous ice ages – and that it has been slowing down under modern warming.
However, whether – and when – an AMOC “tipping point” could occur in a world warmed by greenhouse gases remains a live debate. (For more, see: How do scientists project future AMOC trends?)
Since the early 2000s, the strength of the AMOC has been estimated using vertical moorings installed at different locations of the Atlantic Ocean.
The oldest of these monitoring arrays is the RAPID observing system at a latitude of 26.5 degrees north. The array has collected continuous measurements in the mid-Atlantic and at its eastern and western boundaries – near the Bahamas and the Canary Islands – since 2004.
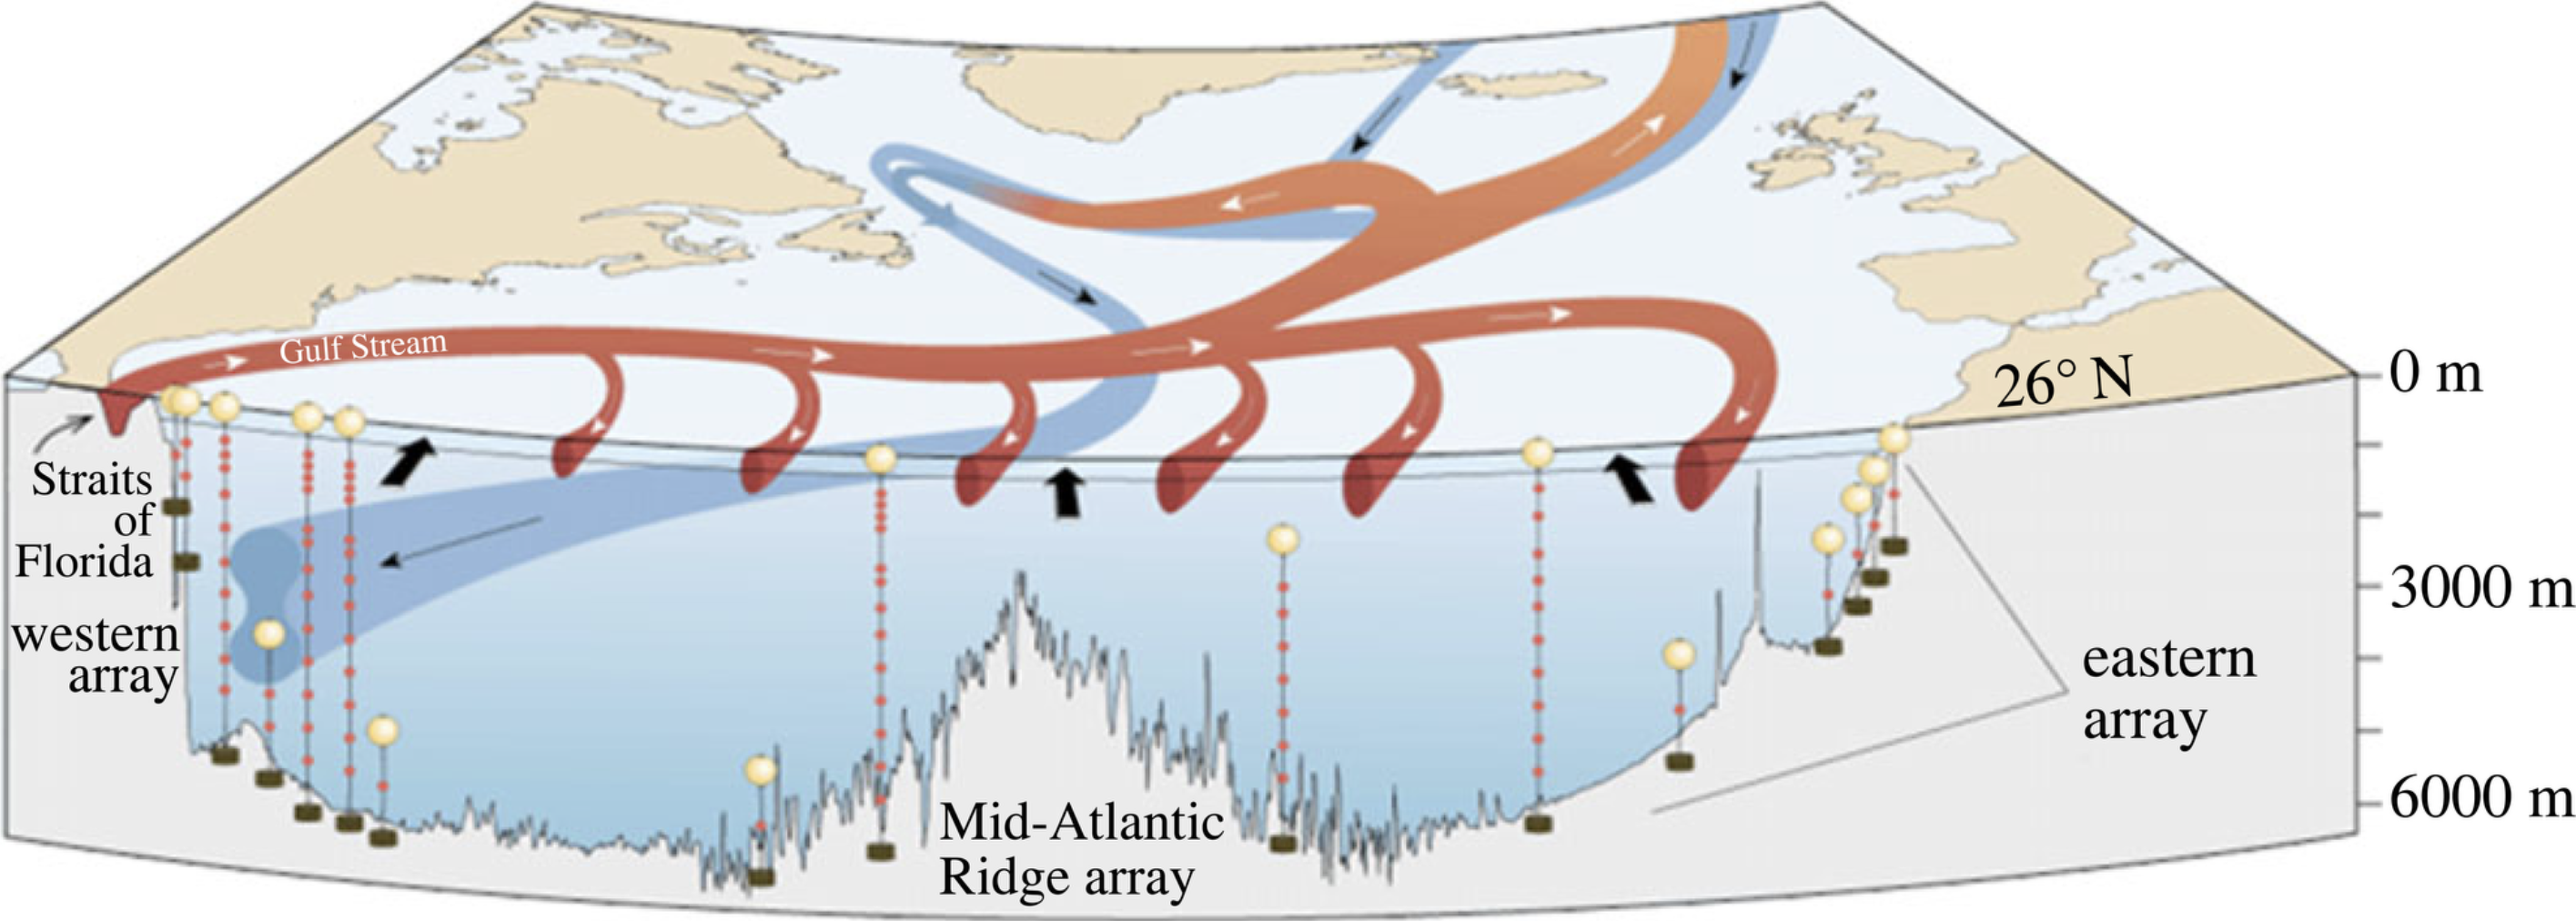
The sensors, which are bolted on to wires, stretch thousands of metres down to the ocean floor and collect measurements of water current, pressure, temperature and conductivity.
Dr Ben Moat, principal investigator of the UK National Oceanography Centre, which maintains the system, tells Carbon Brief that RAPID captures the heat transport of AMOC at its maximum strength:
“The heat that is moved northwards between Florida and the Canary Islands is 1.2 petawatts (PW) of heat – that is equivalent to a million power stations. RAPID was designed specifically to be close to the maximum of that heat transport.”
To get an overall picture of the strength of AMOC, scientists combine RAPID observations with wind observations and measurements of the Gulf Stream captured by an electromagnetic cable in the Florida Straits maintained by the US National Oceanic and Atmospheric Administration (NOAA).
Moat says the RAPID project has “completely revolutionised” scientific understanding of how heat is moved around the Atlantic:
“Until RAPID there was little understanding of how the [AMOC] varied and how it is changing over time.
“Then, along came RAPID and the first results were astounding. Not only did this heat transport vary on daily time scales, it moved on hourly to daily to monthly [time scales]. Now, we are seeing seasonal, inter-year and decadal changes.”
There are now a number of other sensor arrays that help scientists measure the health of AMOC moored in the Atlantic. This includes the OSNAP subpolar array, which has been collecting hourly measurements from the northern boundary of the Atlantic since 2014, as well as the South Atlantic meridional overturning circulation basin-wide array (SAMBA) at 34.5 degrees south, which has been in operation since 2009.
The map below shows the different trans-Atlantic mooring arrays that monitor the AMOC.
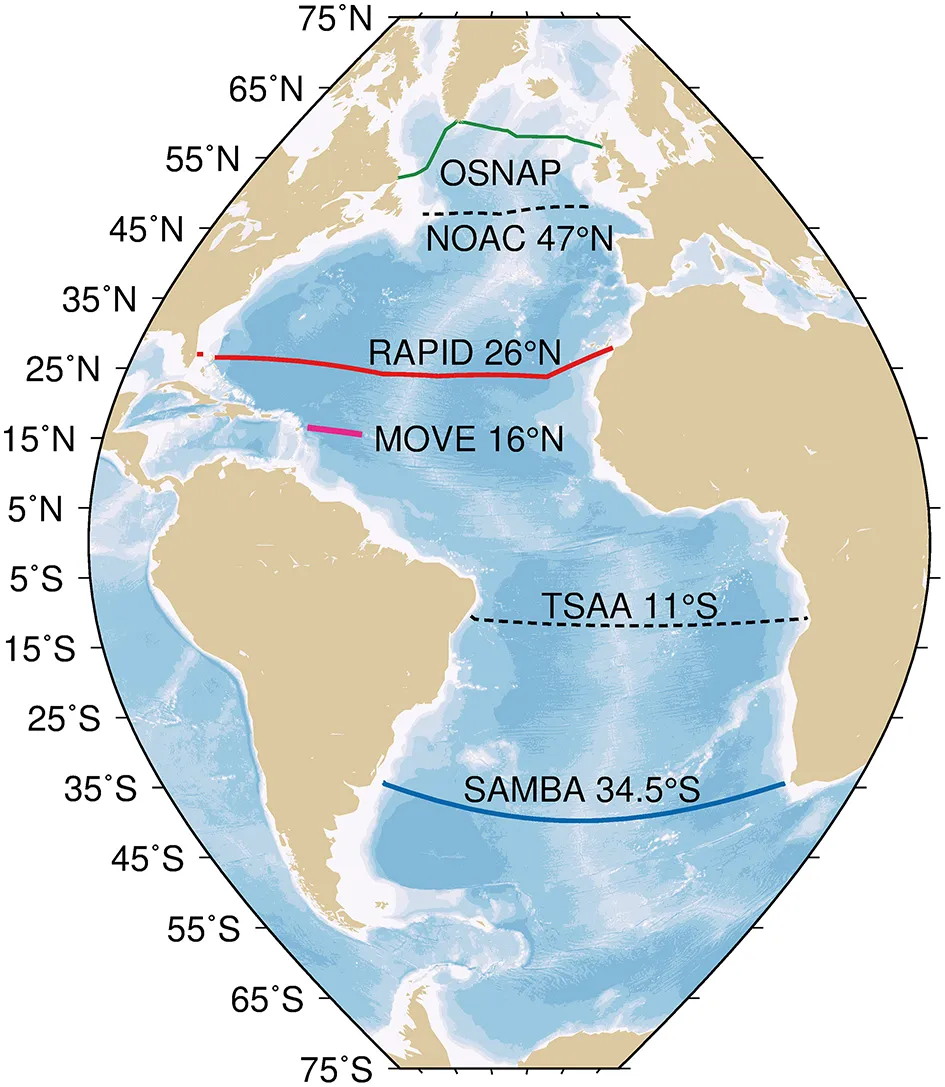
Observing arrays in the Atlantic with AMOC transport estimates from OSNAP (green, operational), NOAC 47N (black dashed), RAPID 26N (red), MOVE 16N (magenta), TSAA 11S (black dashed), and SAMBA 34.5S (blue). Credit: Frajka-Williams et al (2019).
The strength of AMOC is measured in sverdrups (Sv), where one unit represents the transport of one million cubic metres of water per second.
The plot below charts observations captured by the RAPID array since 2004.
AMOC strength measured by the RAPID array in Sv. The solid blue line is the average strength of the AMOC in Sv, the solid black line is the trend and the dashed lines the 95% confidence interval for the trend. Source: NOC. Chart by Carbon Brief.
A 2023 review paper which analysed 20 years of RAPID measurements found that average AMOC strength annually was in the range of 15-17Sv between 2011 and 2020, down from 18-19Sv over 2004-08.
In other words, the ocean conveyor belt transported, on average, 2-3m cubic metres less water every second over 2011-20 compared to 2004-08.
However, it notes that the observational record is “still too short” to disentangle the fingerprint of climate change from decade-to-decade natural climate variability.
For example, the paper attributes a steep decline in AMOC strength over 2007-11 – of 0.6Sv each year – to “wind or buoyancy forcing over the North Atlantic rather than anthropogenically forced [human-caused] change”.
It notes that most of the year-on-year variability over this period can be “reproduced by relatively simple wind-forced models – suggesting that the 2009-10 event may have been primarily a wind-forced response”.
A 2025 Geophysical Research Letters paper which looked at RAPID measurements over 2004-23 noted that the AMOC has weakened by roughly 1Sv per decade, across a range of 0.4-1.6Sv.
This downtrend, it said, is “close” to the pace of decline through to 2100 projected by climate models. (For more on models, see: How do scientists project future AMOC trends?)
Scientists will have to wait until at least 2033 – when there will be 29 years of RAPID data – to be able to confidently disentangle the role human-caused climate change is having on the AMOC, according to 2020 Geophysical Research Letters research.
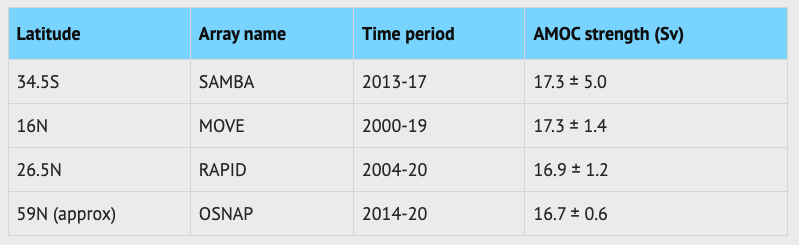
The table below – from the 2023 review – shows average estimates of AMOC strength captured at four trans-Atlantic monitoring arrays (ONSNAP, RAPID, MOVE and SAMBA).
It shows how average AMOC strength at 26.5 degrees north – of 16.9Sv – is broadly consistent with those captured at other arrays, which range from 16.7-17.3Sv.
Determining variations in the strength of AMOC prior to 2004 is more complicated due to the lack of a direct observational record.
Prior to the installation of the RAPID array, direct measurements of the AMOC were limited to a handful of one-off, “snapshot” AMOC observations collected by sensors dropped off research ships.
To gauge changes to AMOC’s strength over a longer period, scientists use indirect ocean observations.
These include ocean temperature and salinity observations, as well as satellite observations of sea surface height.
For example, the existence of the “cold blob” or warming “hole” in the sub-polar gyre region of the North Atlantic has been cited as evidence of a slowdown of the AMOC. This region – the place where the AMOC delivers much of its heat – has cooled as the world has warmed.
This is shown by the map below, where red indicates places which have warmed since the pre-industrial period and blue shows places that have cooled.
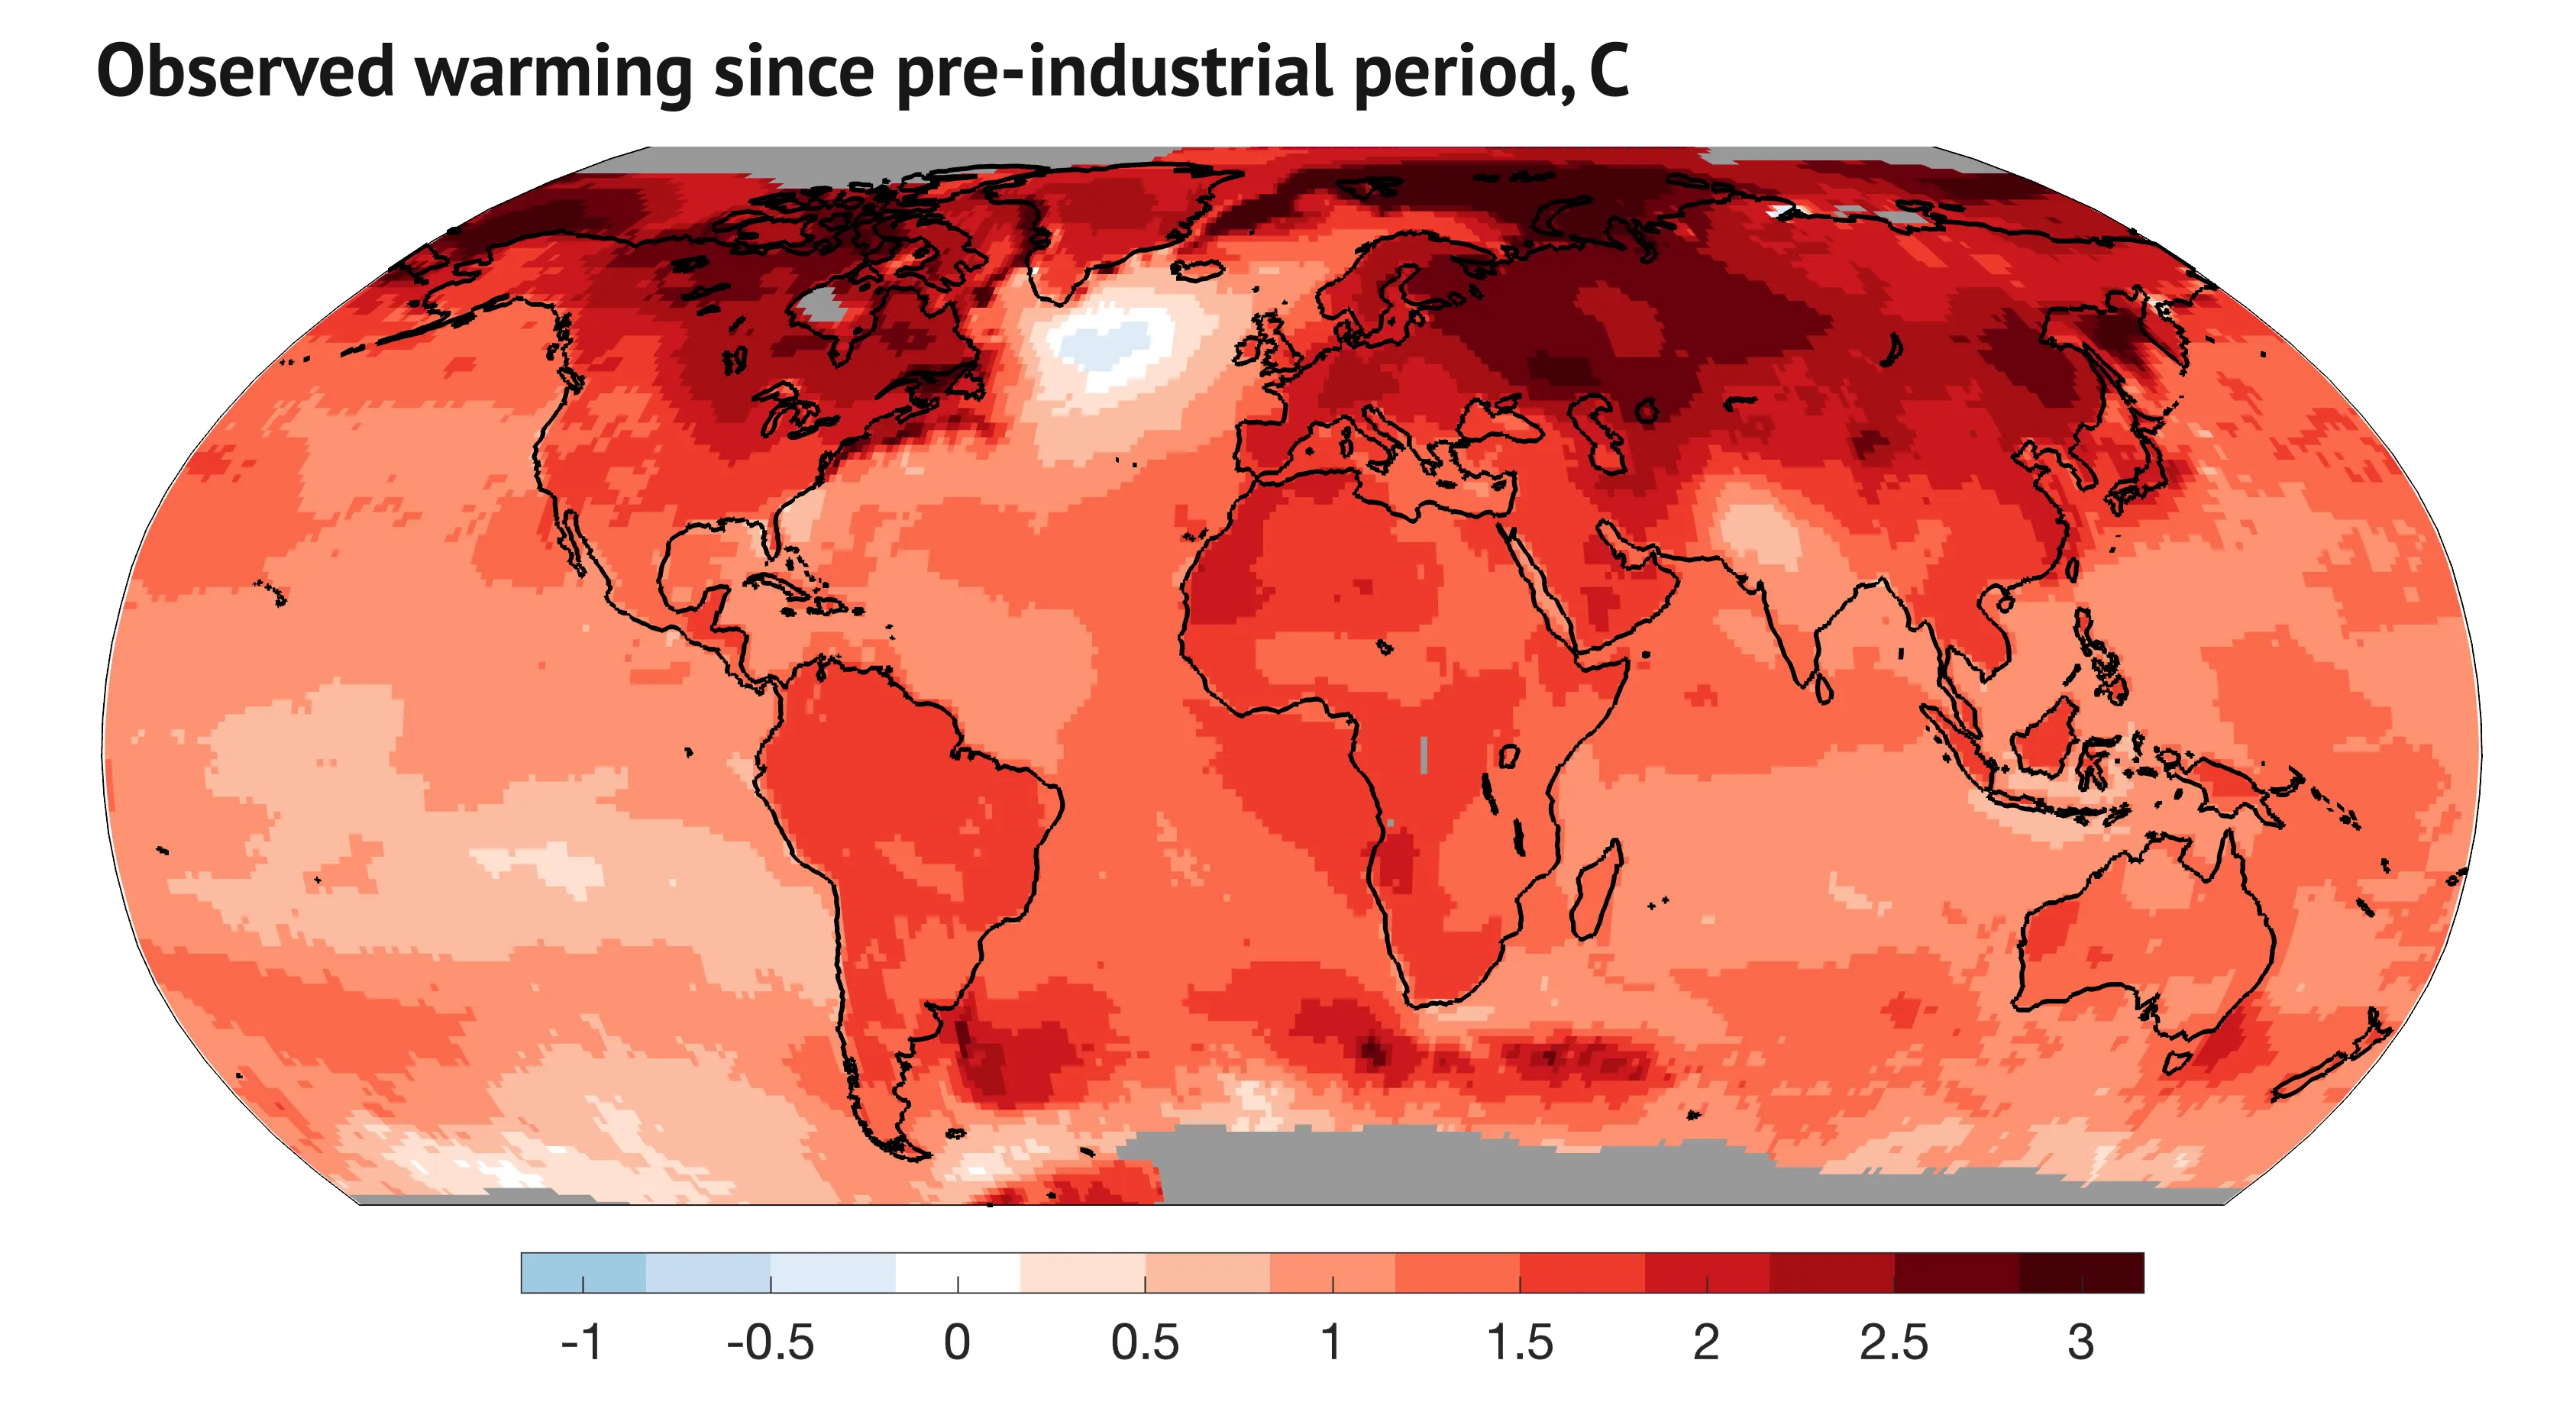
(For more on the human causes of the cold blob, see Carbon Brief’s coverage of a 2020 study in Nature Climate Change.)
To trace changes to the AMOC before satellite and sea surface temperature records began, scientists use proxy records held in marine “archives”, such as coral and ocean sediments.
For example, a 2021 Nature Geoscience paper compared a “variety of proxy records”, including deep-sea sediments and ocean temperature patterns, to reconstruct changes to the AMOC since AD400. It found that the ocean currents during the mid-20th century were at their weakest in one thousand years.
Going back even further in time, scientists have used ice cores and ocean sediment to link oscillations of the Earth’s climate during ice ages to the AMOC. This body of research has suggested that Atlantic ocean currents weakened during cold phases and recovered ahead of relatively warmer periods, in cycles lasting from 1,000 to 100,000 years.
The conclusions that have been inferred from indirect datasets can vary widely, given incomplete data and a diversity of approaches to defining an AMOC indicator.
Scientists also use climate models to run “hindcasts” that simulate how the ocean might have behaved in the past. Hindcasts are model runs exploring the recent historical period that allow scientists to understand how well simulations cleave to observations.
However, there are limitations to how well models can replicate changes to ocean patterns. (For more on climate models and AMOC, see: How do scientists project future AMOC trends?)
The Coupled Modelled Intercomparison Project 5 (CMIP5) models developed for the IPCC’s fifth assessment cycle (AR5) indicated a slowdown of the AMOC over the 20th century. In contrast, the CMIP6 models developed for the IPCC’s sixth assessment cycle (AR6) indicated an increase in AMOC strength over the course of the 100-year period.
The IPCC has updated its assessment of 20th-century AMOC behaviour a number of times.
The 2013 Working Group I (WG1) report of AR5 concluded there was “no observational evidence” of a long-term AMOC decline, based on the then-decade long “record of the complete AMOC” and “longer records of individual AMOC components”.
Six years later, the 2019 special report on ocean and cryosphere stated with “medium confidence” that the AMOC had weakened relative to 1850-1900. However, it noted that data was “insufficient” to quantify that weakening or to attribute it to human-caused climate change.
More recently, the 2021 WG1 report of AR6 noted that its confidence levels in “reconstructed and modelled AMOC changes” had decreased. It stated that it had “low confidence” in the weakening of AMOC in the 20th century.
Thus, while direct observations reveal a weakening of AMOC over the last two decades, incomplete data means the picture before the 21st century is less certain.
The term “collapse” is used in different ways in the scientific literature about AMOC.
An AMOC that is no longer able to transport heat around the planet is often referred to as being “collapsed”, “shutdown” or as being in an “off” state.
Other research uses the term ”collapse” to describe the juncture where AMOC has “tipped” – in other words, started an almost-irreversible transition towards an extremely weak state. This is also sometimes described as the “start of collapse” or “AMOC collapse onset”.
The transition of AMOC from the moment of its “tipping” to its stabilisation in a new, weak state would take somewhere up to, or even more than, 100 years, according to recent modelling studies.
Meanwhile, in climate modelling, a collapsed AMOC is typically one that has stabilised at a weak state of between, or below, 3-6Sv – roughly one-fifth to one-third of the strength of AMOC over 2011-20. In these modelled worlds, the AMOC may, or may not, be able to return to a stronger state if warming was reserved.
Prof Stefan Rahmstorf from the Potsdam Institute for Climate Impact Research (PIK) explains that 6Sv is a “common threshold” that researchers use in model runs for a collapsed AMOC. At this strength, he says, the AMOC has just “weak, shallow overturning” and “hardly any influence on heat transport or climate”.
His colleague Prof Niklas Boers at PIK says the definition of AMOC “collapse” is a “matter of convention”. The common characterisation of a collapsed AMOC as one that has stabilised below a certain strength threshold – “regardless of whether it is reversible or not” – is “fair”, he says.
However, Boers notes that this definition does not answer the “practically relevant” question of whether the “AMOC is tipping – in the sense of, can it come back or not?”
Dr René van Westen, a researcher at Utrecht University, says that measuring AMOC in terms of strength in sverdrups does not provide a full picture of AMOC’s ability to redistribute heat. Heat transport around the Atlantic could start to break down well above a 6Sv threshold, he explains:
“AMOC strength is the most compelling [characteristic] because it is very easy to communicate. But it can sometimes give you a mixed view [on AMOC collapse]. There will be instances where you get a shallow residual AMOC that can be above this arbitrary [6Sv] threshold.”
Other variables to look out for when assessing AMOC’s health, according to van Westen, include patterns of oceanic heat transport across Atlantic Ocean latitudes and the presence of “sinking and deep water mass transformation” in the North Atlantic.
To explore how the AMOC might behave in the future – and what the impacts of it might be – scientists turn to climate models.
Climate models have long predicted an AMOC slowdown in response to global warming. However, model projections of the future health of the AMOC vary widely.
In AR6, the IPCC said the AMOC will “very likely decline” over the 21st century across all shared socioeconomic pathway (SSP) scenarios.
(For more on the scenarios themselves, see Carbon Brief’s explainer.)
The IPCC’s projections suggest that in a low-emissions scenario, the AMOC will weaken by about 24% (with a range of 4-46%) by the year 2100, depending on the model. It projects a reduction of 39% (with a range of 17-55%) in a very high-emissions scenario.
An analysis of a “majority cluster” of CMIP6 model projections in a 2020 paper found that, on average, the AMOC could weaken by 34% in a low-emissions scenario and 45% in a very high-emissions scenario by the century’s end, equivalent to a 6-8 Sv decline at the RAPID array.
(When the analysis was not limited to this group of models, the paper projected a decline of 24% in a low-emissions scenario, 29% in a medium-emissions scenario, 32% in a high-emissions scenario and 39% in a very high-emissions scenario by 2100.)
In a 2026 Science Advances paper, researchers attempted to refine estimates of the AMOC’s future behaviour by incorporating real-world observations into model projections. The research found that – once these “observational constraints” are taken into account – model projections show the AMOC could slow down by 51% by 2100 in a medium-emissions scenario.
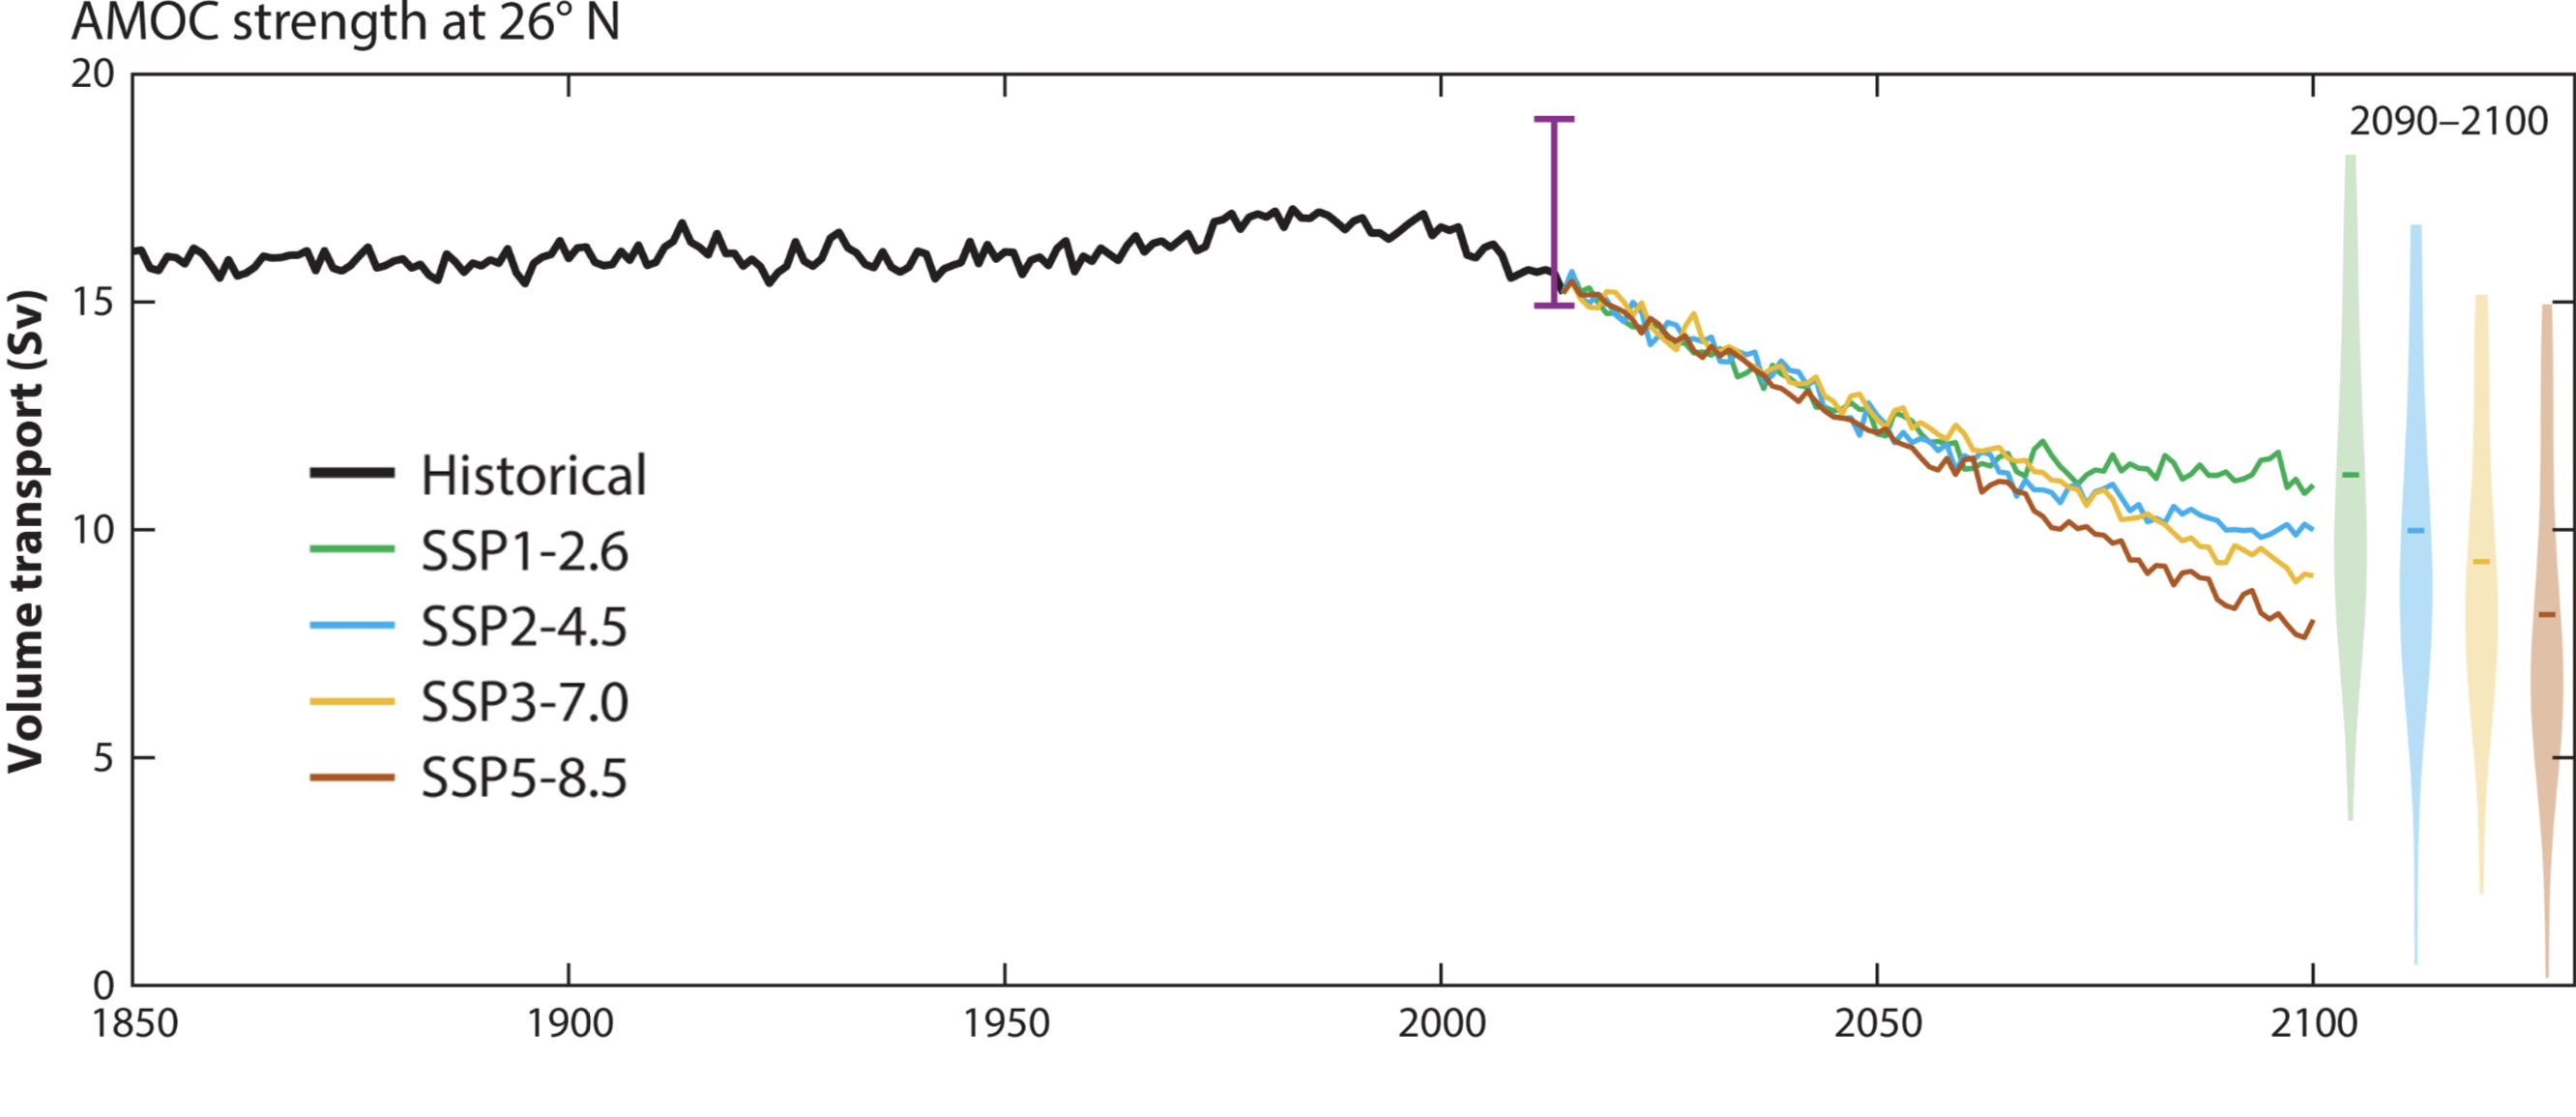
The line chart below, from a 2026 review paper, illustrates CMIP6 model projections for AMOC’s health over 1850-2100. The black line indicates the maximum strength observed at 26 degrees north and the colourful lines indicate average projections under different emissions pathways from 2014 onwards.
The violin plots on the right shows the spread of AMOC strength outcomes projected by the end of the 21st century under different emissions pathways, as projected by CMIP6 models.
A substantial body of research has found that IPCC models lean towards unrealistic levels of stability in the AMOC. This has been backed up by hindcasts.
The IPCC acknowledges the limitations of current tools for projecting the future health of AMOC. In AR6, it stated that – despite having “high confidence” in future AMOC weakening as a “qualitative feature” based on “process understanding” – it has “low confidence” in “quantitative projections” of AMOC decline in the 21st century.
Dr Laura Jackson from the UK Met Office explains why the AMOC is difficult to model:
“The AMOC is not a specific thing – it is the impact of lots of different currents. It is affected by processes happening at small scales, like mixing and eddies which affect how the heat and salt are distributed. We can’t resolve many of these with climate models.”
Common issues with models, according to the 2026 review, are a “too-shallow AMOC pattern, a too-strong recirculation in the upper mid-ocean, a too-weak meridional heat transport and an underestimation of interannual and decadal variability”.
A limitation in IPCC models is that they do not incorporate the impacts of freshwater being added to the north Atlantic as the Greenland ice sheet melts.
To address this limitation, researchers adjust climate models to add levels of freshwater input to the north Atlantic for a fixed length of time. This is known as “hosing”.
To investigate models’ sensitivity to an influx of freshwater in the North Atlantic, six global modelling groups ran a series of “hosing experiments” with eight CMIP6 models (from six modelling centres) as part of the North Atlantic Hosing Model Intercomparison Project.
In findings published in 2023, the researchers noted that half the models tested in the experiment “recovered” after “hosing of 0.3Sv”, whereas the remainder “remained in a weakened state”.
The study explained that the model runs explored are “unrealistic” and not future climate scenarios. However, it said that analysis of the similarities and differences between model responses helps scientists “understand what controls…AMOC response and how the real world may behave”.
Given the limitations of models, in recent years scientists have turned to other methods to understand the future behaviour of the AMOC, including “early-warning signal” studies.
Early-warning signal studies look for other factors in the historical record and model runs that provide an indicator for whether the AMOC is approaching a tipping point.
These can be “statistical indicators” – patterns in data timeseries, such as sea surface temperature or ocean salt content.
They can also be “physics-based indicators”, which are physical processes tied to AMOC stability. These mechanisms are linked to the dynamics of the ocean, such as water buoyancy and freshwater transport.
An example of a study that looked at statistical indicators is a 2021 Nature study that analysed four temperature and four salinity data series linked to AMOC strength. It concluded there was “strong evidence that the AMOC is indeed approaching a critical, bifurcation-induced transition”.
(When a system undergoes a “bifurcation” – which means to divide into two branches – it is subsequently difficult, if not impossible, for the system to revert to its previous state.)
A 2023 Nature Communications paper analysed sea surface temperature in the sub-polar gyre region to make a headline-grabbing prediction of a “forthcoming collapse” of the AMOC. The paper projects that AMOC “collapse” could “occur” between 2037 and 2109 – and most likely around the middle of this century.
Meanwhile, a 2024 Science Advances study said it had identified a new “physics-based early-warning signal” that showed AMOC is “on route to tipping”. The indicator used related to the minimum amount of freshwater transported by AMOC at the southern boundary of the Atlantic.
A 2026 Communications Earth & Environment paper identified “abrupt” changes to the path of the Gulf Stream as an “early-warning indicator” of an AMOC “collapse” or “tipping”.
PIK’s Rahmstorf says that debate remains about the usefulness of studies which look for signs that indicate the collapse of the AMOC. Scientists are still looking for “better, more reliable and observable” warning signals, he says, explaining:
“We are never going to get a [fully] reliable ‘early warning’ because the uncertainties around the data availability are just too large. That was already my feeling in the early 2000s when this kind of work started. I thought that, theoretically, this is nice – if only we had the data. But, the problem is, we don’t have 100 years of accurate AMOC data.”
His colleague Boers says that early-warning studies can help scientists interpret whether a system is moving towards a tipping point, but should not be used to make timing predictions:
“The AMOC’s stability has declined. It has moved closer towards a possible tipping point. But we cannot say when that might happen. Even if we knew the exact evolution of future temperatures, then there’s still way too many other uncertainties to make any meaningful prediction of the time at which this could happen.
“So, early warning in terms of a prediction? No way. It just doesn’t work.”
In AR6, the IPCC notes it has “medium confidence” that the decline of AMOC will not involve an “abrupt collapse” before 2100. (An “abrupt” change in IPCC lingo is an event taking place in three decades or less.)
The IPCC’s findings were backed up by a 2025 Nature study that examined the future stability of the AMOC in 34 climate models adjusted to simulate varying levels of greenhouse gas emissions and freshwater input.
The researchers found that an AMOC collapse – defined in a correction notice as a “weakening to below 6Sv” – was “unlikely” this century, noting that, “in all cases”, the ocean circulation was sustained “by upwelling in the Southern Ocean, driven by persistent Southern Ocean winds”.
(The paper in question prompted some debate around how scientists define AMOC “collapse” by 2100.)
A number of recent papers have argued that the risk of AMOC collapse has been underestimated.
For example, a study published in Environmental Research Letters in 2025 explored the future health of AMOC by running a number of IPCC climate models beyond their typical 2100 cut-off. It found that an AMOC shutdown would occur after 2100 in 67% of all runs in a very high-emissions scenario, 30% of all runs under a medium-emissions scenario and 25% in a low-emissions scenario.
The “precursor” to a “weak and shallow AMOC” after 2100 is the collapse of “maximum mixed-layer depth” in the North Atlantic in the middle of this century, according to the study.
The researchers said that “such numbers…no longer comply with the low-likelihood, high-impact event that is used to discuss an abrupt AMOC collapse in AR6 and this assessment needs to be revised in [the IPCC’s upcoming seventh assessment report]”.
(It is worth underlining that the IPCC’s discussion of potential AMOC collapse is in the context of the 21st century, whereas the Environmental Research Letters study explores potential outcomes post-2100.)
Another recent study, published in JGR Oceans in 2025, found that the AMOC could “begin to collapse” as soon as 2063 under a medium-emissions scenario.
The researchers determined that AMOC is on a tipping course once a threshold – a “physics-based indicator” – related to water sinking is crossed. After analysing when this trigger point occurred in various model runs, they pinned the “AMOC tipping threshold” at around 2.5C of global warming above the pre-industrial average.
The research noted that a “previous critical temperature threshold of 4C warming for AMOC tipping” – set out in a 2022 Science paper – “should be revised”.
Van Westen – who was involved in both the JGR Oceans and Environmental Research Letters studies – highlights that both papers identify a threshold likely to be crossed in the 21st century that would mark a “point of no return” for the AMOC. He says:
“The most interesting AMOC dynamics happen after 2100, but most [climate model] simulations are terminated at 2100 because it is computationally too expensive [to run them].
“[Our research shows] that many [simulations to 2100] have already reached a critical value where AMOC has started to tip – a process that could then take 100 years. In those, the [simulated] AMOC might be at 12Sv by 2100, but actually it is already collapsing.”
An AMOC shutdown would transform weather patterns, with drastic consequences for Europe, the Amazon rainforest and food systems.
In AR6, the IPCC summarised the potential effects of an AMOC collapse as follows:
“If an AMOC collapse were to occur, it would very likely cause abrupt shifts in the regional weather patterns and water cycle, such as a southward shift in the tropical rain belt, and could result in weakening of the African and Asian monsoons, strengthening of southern hemisphere monsoons and drying in Europe.”
A 2025 study in Geophysical Research Letters looked at the combined effects of global warming and a full AMOC collapse on Europe. (For more, read Carbon Brief’s in-depth coverage of the research.)
The study found that, in a medium-emissions scenario, greenhouse gas-driven warming would not be able to outweigh the cooling impact of an AMOC shutdown. In this modelled world, cold extremes could approach -20C in London and -48C in Oslo.
The cold temperatures in north-west Europe would be driven by the loss of heat transfer from the tropics via ocean currents, as well as the encroachment of sea ice across northern Europe in winter, the study noted.
Separate research published in 2025 in Hydrology and Earth System Sciences found that an AMOC collapse under a medium-emissions scenario would lead to increasing drought in southern Europe.
The impacts of a shutdown of AMOC on the global south is a growing area of research. There is evidence that the shutdown of the ocean currents could lead to a major rearranging of global monsoon systems in regions where more than half of the world’s population live – and increased drought in the Sahel.
A 2024 Science Advances study found that – in a modelled world without global warming, but a full AMOC collapse – the Amazon rainforest would see a “drastic change” in rainfall patterns with the “dry season set to become the wet season and vice-versa”.
Several studies have shown that sea levels on the east coast of the US will rise more quickly if the AMOC weakens. A 2015 Nature study pointed to a 30% downturn of the AMOC over 2009-10 as one of two factors for an “unprecedented” 128mm jump in sea level north of New York City over the two-year period.
Other research has explored the impact of a collapse of AMOC on food supplies. For instance, a 2020 study in Nature Food found that the collapse of the ocean currents could result in the “widespread cessation of arable farming” in the UK and “losses of agricultural output…an order of magnitude larger than the impacts of climate change without an AMOC collapse”.
Meanwhile, other scientists have warned that damage to the mechanism which allows the ocean to store carbon could lead to more CO2 collecting in the atmosphere.
A 2026 paper, published in Communications Earth & Environment, found that AMOC collapse – defined as a “rapid weakening to a nearly complete shutdown with a maximum strength below 5Sv” – would increase atmospheric carbon dioxide by 47-83 parts per million (ppm).
This, the researchers said, would lead to around 0.2C of additional warming, once “ocean-dynamics-driven cooling” was taken into account. (To reach their conclusions, the researchers ran experiments using a fast Earth system model, exploring scenarios where baseline CO2 levels ranged between 350-600ppm.)
Scientists have noted that the shutdown of the AMOC could have a “cascading” effect on other critical Earth systems, which are themselves at risk of tipping.
Prof Nico Wunderling, a scientist at PIK’s Earth Resilience Science Unit, explains that the AMOC is the “strongest interactor across all of the climate tipping elements” because it links the cryosphere – the portions of Earth where water is in solid form – to the ocean, atmosphere and biosphere. He tells Carbon Brief:
“When the AMOC changes, it changes not only ocean temperatures, which then act on the cryosphere [the Greenland ice sheet, the West Antarctic ice sheet, permafrost and Arctic and Antarctic sea ice], but it changes atmospheric patterns, such as the Intertropical Convergence Zone [a band of low pressure around the Earth which generally lies near to the equator] and other winds in the global climate system. That means rainfall patterns change, which then impacts biosphere [tipping] elements such as the Amazon rainforest.”
The map below shows how the collapse of the AMOC could end up destabilising a number of the Earth’s tipping elements, including the West Antarctic ice sheet and the Amazon rainforest. The red arrows illustrate destabilising effects between different tipping elements.
The AMOC is receiving increasing media attention around the world.
Carbon Brief analysis reveals how the number of news articles to mention “Atlantic Meridional Overturning Circulation” has grown over the past 20 years, from 14 in 2006 to 1,033 in 2024. This is shown in the chart below.
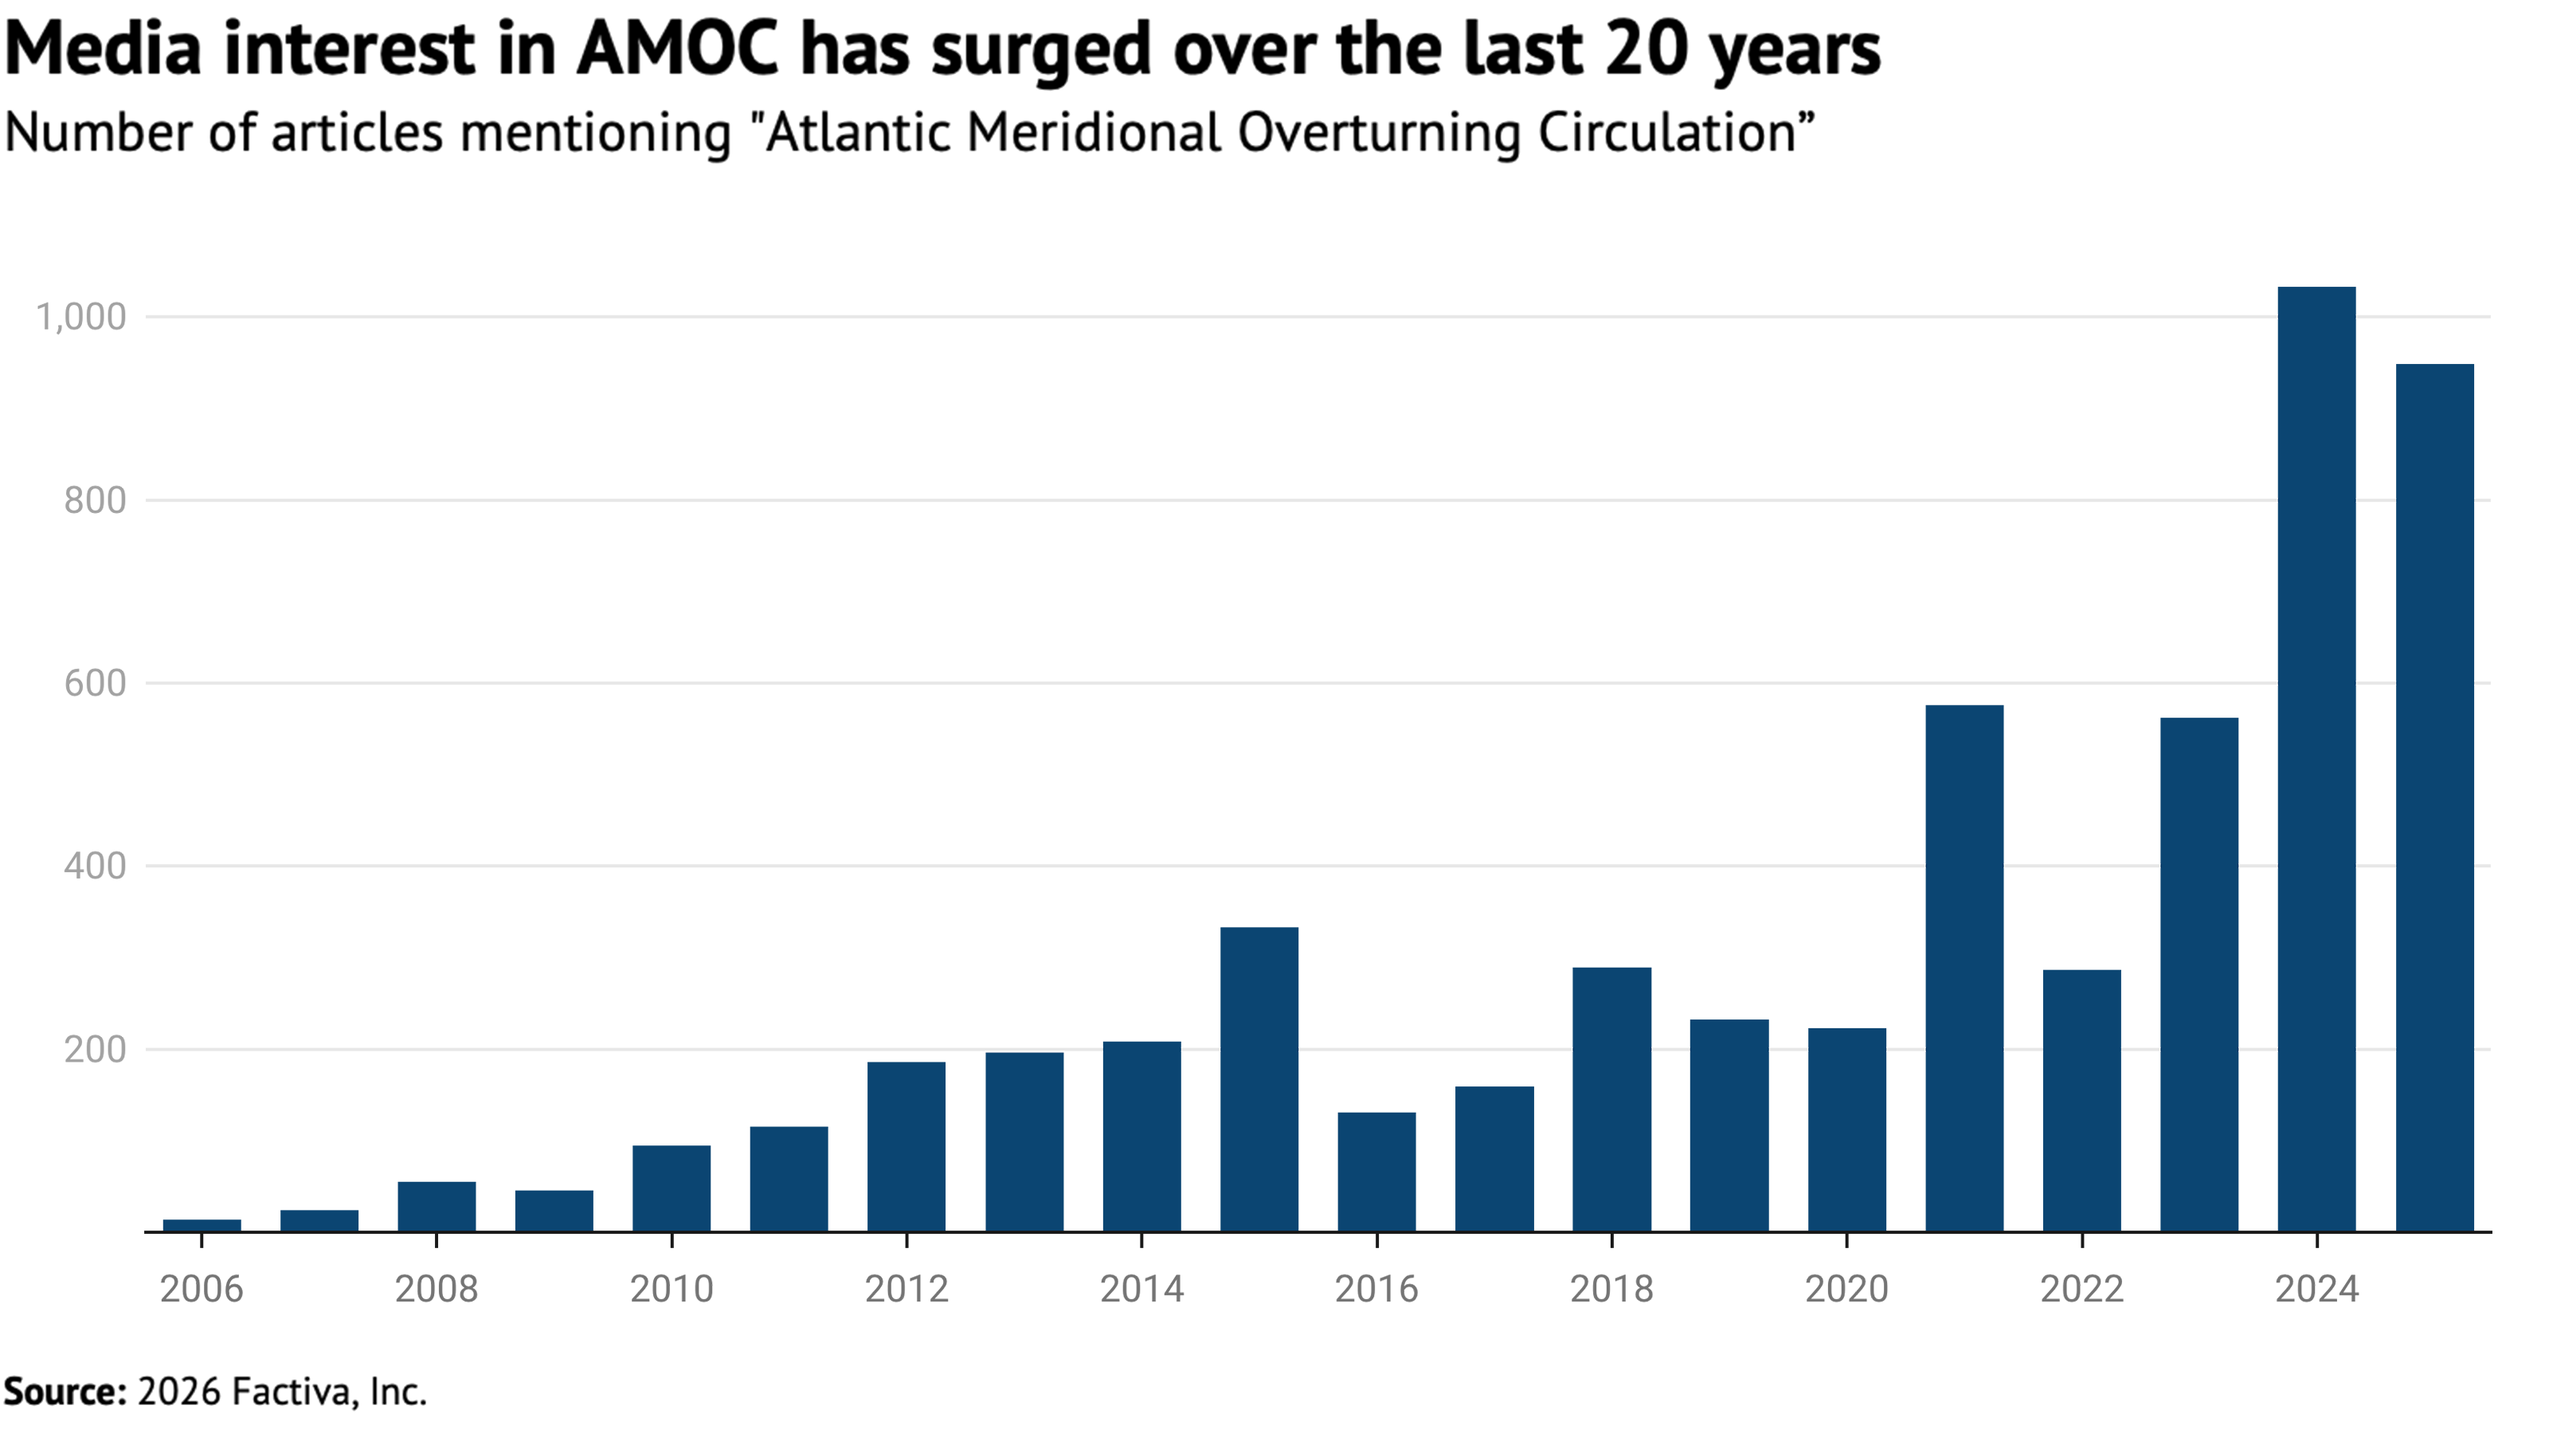
Annual number of articles that mention “Atlantic Meridional Overturning Circulation” over 2006-25, according to Factiva, a news database which counts more than 33,000 newswires and national, international, local and business news sources. Data – which can be viewed here – accessed by Carbon Brief on 5 February 2026.
The chart above is designed to give a sense of trends in media coverage. The overall number of articles discussing AMOC is likely far greater. Carbon Brief limited its analysis to references of the full term “Atlantic Meridional Overturning Circulation” and not the AMOC acronym. (This was done to exclude articles related to, among other things, the Alexandria Mineral Oils Company and “alternative methods of compliance” in aviation.)
There is also frequent conflation in the media of AMOC with its component, the Gulf Stream. Articles that only mention the Gulf Stream are not captured in the analysis.
Coverage of AMOC science is often sensationalist in tone, with journalists frequently evoking catastrophic scenarios depicted in the 2004 blockbuster film The Day After Tomorrow. The film depicts the rapid onset of a new ice age after melting sea ice prompts Atlantic circulation patterns to almost instantaneously collapse.
In 2024 and 2025, 195 and 81 articles, respectively, referenced the disaster film in AMOC coverage, according to Factiva. (This averages at roughly 19% and 9% of the total.)
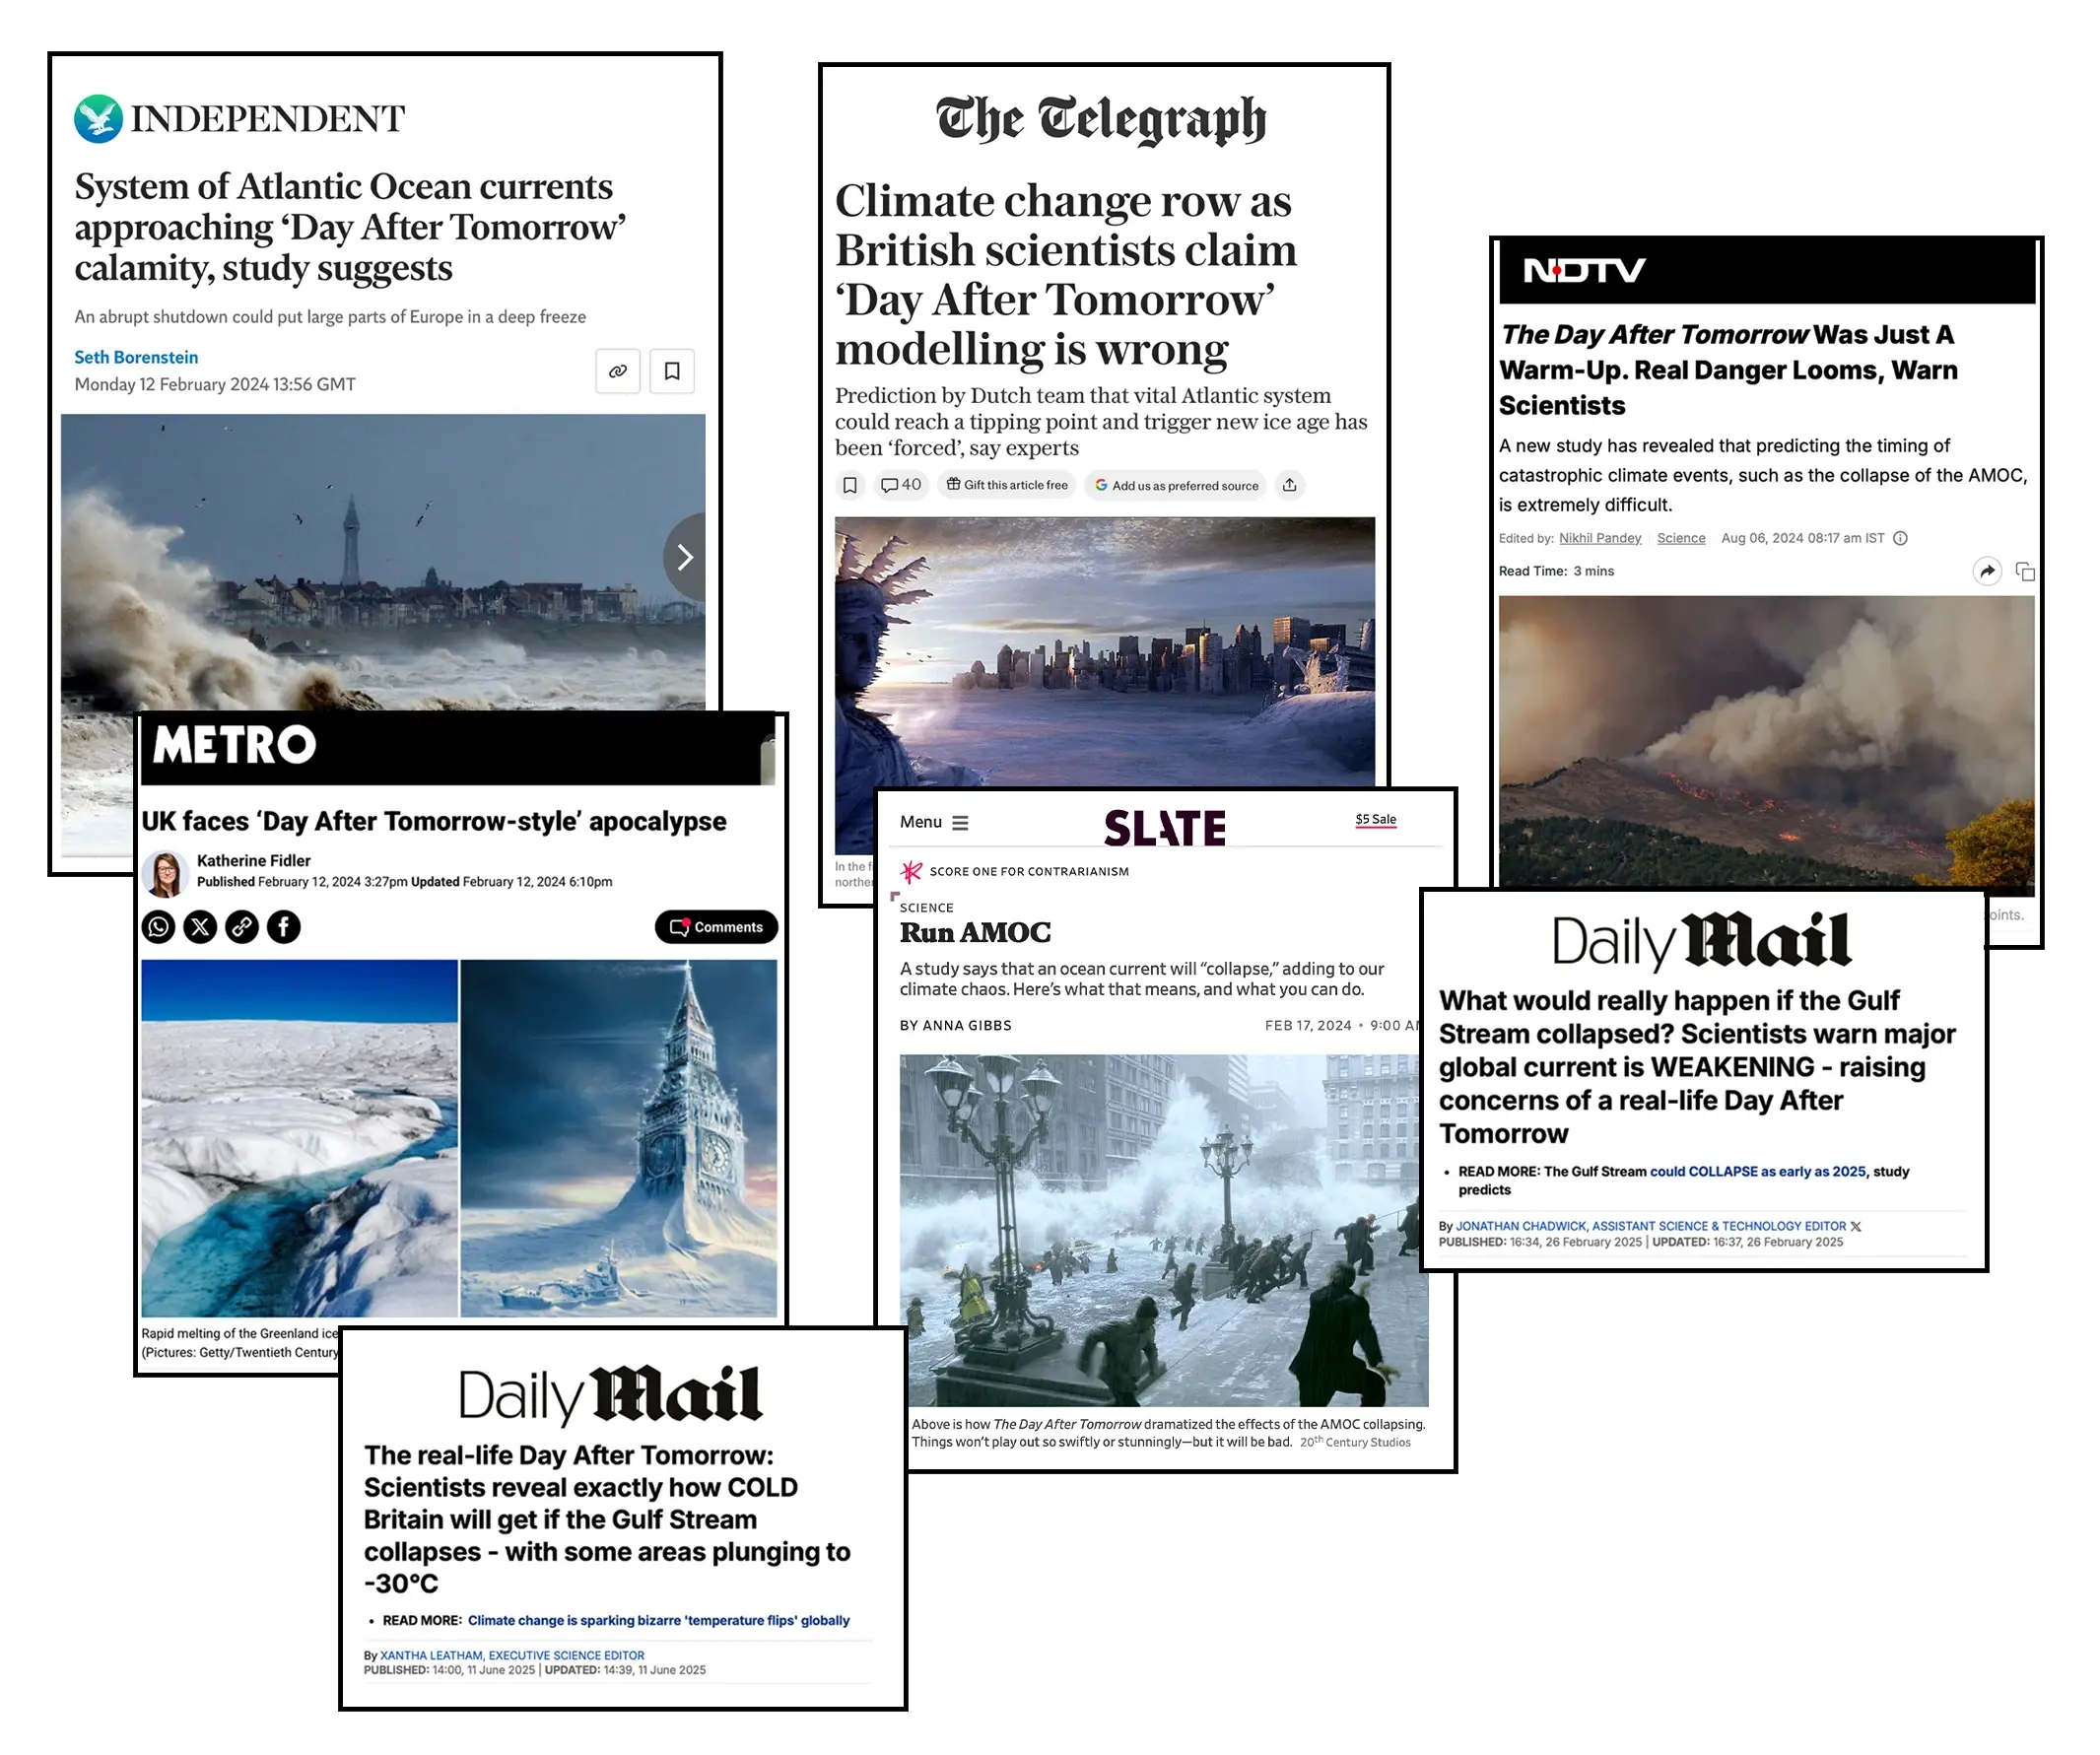
Jackson from the Met Office says the film helps to feed a common “misconception” that AMOC collapse would occur quickly. She tells Carbon Brief:
“I get the impression some people think that [AMOC collapse] is like in The Day After Tomorrow and happens over a few days. Whereas what we are thinking about happens over decades or maybe a century.”
However, there has been a rise in longer-form, explainer articles about AMOC science.
Over the past two years, the Financial Times, New York Times, New Scientist, Vox, Mother Jones, MIT Technology Review, Washington Post and WIRED have dedicated long-reads to explaining the risks and science of AMOC.
At the same time, climate-sceptic outlets, such as the UK’s Daily Telegraph and Daily Mail, have highlighted scientific uncertainties and debates within AMOC research.
PIK’s Rahmstorf says he has noted a “whiplash effect” in the media – where the conclusions of new AMOC studies are presented as definitive. He explains:
“As scientists, we look at a whole suite of studies that exist on one topic…We look at the overall balance of evidence. Whereas the media oscillates back and forth between saying ‘this latest study proves AMOC is weakening’ [or] ‘this latest study shows it’s not weakening after all’. And then, the public, of course, is quite confused.”
He adds the media tends to err towards dramatic conclusions on AMOC:
“There are extremes in both directions. Some media articles really exaggerate [the probability and impacts of AMOC collapse] and then other media articles try to play it down as a risk. Admittedly, it is hard to get the balance right – but there are also political interests behind it as well.”
In February 2024, the AMOC received a bump of coverage after dozens of climate scientists wrote to ministers of Nordic countries to underscore the risks of AMOC collapse and the need for action to cut greenhouse gas emissions. The Guardian, Reuters, Euronews, Daily Mail, Vice News, Gizmodo and Geographical were among the publications to cover the intervention.
Also in 2024, the aforementioned Science Advances study that warned AMOC was on a “tipping course” topped Carbon Brief’s annual list of the most-covered science research of the year.
It remains unclear whether growing coverage of AMOC has focused policymakers’ minds on the question of AMOC collapse.
The topic has been debated three times in UK parliament – in 2006, 2024 and 2025, according to the parliamentary record. It was also the subject of one written question in 2024, to which a minister replied that the government had “not assessed the effect” of any slowing or collapse of the AMOC, but was “monitoring ongoing research”.
In Ireland – another country whose mild climate relies on the AMOC – official records show the issue has been debated twice, in 2024 and 2025. It has also been the subject of one written question.
In November 2025, Iceland’s climate minister Johann Pall Johannsson told Reuters that the country had officially designated the potential collapse of AMOC a national security concern.
Carbon Brief would like to thank all the scientists who helped with the preparation of this article.
Cleveland-Cliffs appears poised to lock its Middletown Works steel mill into using fossil fuels for at least the next two decades.
The steel manufacturer had already abandoned its plan to replace a coal-based blast furnace at the southwest Ohio plant with cleaner, hydrogen-ready technology and electric furnaces. That project, which won a $500 million federal grant during the Biden administration, was meant to mark America’s entry into the global race to make greener steel.
Now, Cliffs seems ready to refurbish its old Middletown blast furnace so that it can keep running on coal, and to add a cogeneration plant that makes electricity and steam from waste gas. The company has not ruled out the possibility that it might pay for part or all of the work using money from the grant — which Congress required the Department of Energy to spend for the purpose of accelerating industrial decarbonization.
Cliffs described the project in an air-permit application submitted in late February to the Ohio Environmental Protection Agency, though the steelmaker hasn’t yet publicly announced the initiatives.
The filings represent the latest twist for the Middletown steel mill, the longtime economic engine of Vice President JD Vance’s hometown.
Cliffs’ plans have been murky ever since the company ditched its hydrogen ambitions last year. In a July earnings call, CEO Lourenco Goncalves said only that Cliffs was working with the DOE to develop a new scope for the federally funded project, in a way that will “preserve and enhance” Middletown’s use of coal and fossil gas. Goncalves later confirmed that Cliffs’ grant remained intact, having been spared from the Trump administration’s sweeping cancellation of other DOE-backed efforts to decarbonize U.S. industrial facilities.
It is unclear whether the company and energy agency will come to any agreement on revamping the project, and if they do, how much of the federal funding the company might use for the work now planned at Middletown. The DOE has not responded to Canary Media’s repeated requests for comment.
Cliffs received its award in 2024 through the $6.3 billion Industrial Demonstrations Program, which was primarily funded by the 2022 Inflation Reduction Act. In appropriating those dollars, Congress stipulated that the DOE should help companies deploy “advanced industrial technology” that is “designed to accelerate greenhouse gas emission reduction progress to net zero” at U.S. manufacturing facilities.
The steelmaker’s plan to adopt hydrogen-ready technology could have eliminated roughly 1 million tons of greenhouse gas emissions per year from Middletown Works. It was also expected to create 170 new permanent jobs, in addition to safeguarding 2,500 positions at the facility. Cliffs’ latest proposal, which focuses on energy-efficiency improvements, is unlikely to deliver anywhere near the potential emissions reductions that would have resulted from the original project.
For green-steel proponents, Cliffs’ effort to squeeze more life out of its existing coal-based capacity is a missed opportunity to invest in cleaner and modern alternatives.
Relining blast furnaces is typically done about every 20 years, while building cogeneration plants is a fairly standard way for heavy industry to boost energy efficiency and improve the performance of older factories. Neither step represents the sort of transformative solutions that the federal awards were meant to support, according to former energy staffers who worked on the industrial-decarbonization initiative.
The DOE program’s goal “was to invest in early-stage, commercial-scale deployments of next-generation industrial technologies that can help plants be more efficient — and also to reduce emissions and make air and water cleaner for the people who live around these facilities, and the workers who work in them,” said Ian Wells, a senior advocate for the Natural Resources Defense Council.
Wells said he was concerned about the possibility of federal grants “being used to double down on more legacy technologies, instead of using public funding to take the risk on new approaches that could be better in the long term.”
The Ohio Environmental Protection Agency will have until mid-August, or 180 days from the filing of the application, to either approve or deny a permit to Cliffs. The company has not received funding from the Ohio EPA for any part of the project, said Anthony Chenault, a public information officer for the agency.
Cliffs intends to start construction on its so-called Energy Recovery and Advanced Efficient Ironmaking Project on Sept. 29, according to its application. As for its federal grant, any DOE money provided through the Inflation Reduction Act must be obligated by the end of this fiscal year, on Sept. 30, and spent within five years.
Cliffs’ pivot away from hydrogen in Middletown is a major about-face for a company that previously won recognition from the DOE for cutting its U.S. operations’ greenhouse gas emissions by nearly a third.
In March 2024, the energy agency chose the steel mill as the place to unveil its broader effort to decarbonize and modernize key U.S. manufacturing sectors for steel, cement, chemicals, and even food processing. “What you do here in Middletown, we’ll be looking at how we can replicate that in places all across the country,” then–Energy Secretary Jennifer Granholm said at the 2,800-acre site.
At the time, Cliffs planned to replace Middletown’s old blast furnace — a hulking facility that melts iron ore with purified coal, or “coke,” and limestone to make molten iron. About 70% to 80% of the planet-warming emissions that result from conventional steelmaking are associated with using coke and coal in blast furnaces.
In its stead, Cliffs intended to build a “direct reduced iron” facility that could be fueled by fossil gas, which would reduce the carbon-intensity from ironmaking by more than half. The plant would also be able to use a mix of gas and hydrogen, or hydrogen alone. If the hydrogen was made using renewable electricity, then it could have reduced the facility’s carbon-intensity by over 90%.
The steelmaker also planned to install two electricity-powered melting furnaces that would feed iron from the new DRI facility into an existing basic oxygen furnace — a heated vessel that blows oxygen over iron to produce steel. Cliffs said it expected to invest $1.3 billion, on top of the $500 million federal grant, and complete the project by 2029.
That was all before President Donald Trump took office in January 2025 and began gutting federal investments in clean domestic manufacturing.
To be sure, shifting to hydrogen-based production was always going to be challenging for Cliffs and other steelmakers, in large part because green hydrogen is expensive and in scarce supply. The Swedish firm SSAB backed out of its own $500 million DOE grant during Biden’s term after the company’s green-steel project in Mississippi ran into hydrogen supply troubles.
Still, the Trump administration canceled several of the hydrogen hubs meant to boost domestic production of the fuel and bring down its cost. The Mid-Atlantic Clean Hydrogen Hub, which would have supplied Middletown Works, remains approved but in limbo. Nonetheless, Cliffs decided to call it quits.
“It’s clear by now that we will not have availability of hydrogen,” Goncalves said during that July earnings call. “So, there is no point in pursuing something that we know for sure that’s not going to happen.”
Cliffs’ application with the Ohio EPA proposes replacing and repairing major equipment at the 73-year-old No. 3 blast furnace. Cliffs said the fixes could lower energy consumption and reduce the amount of coke that’s used for every ton of hot metal the furnace produces. The steelmaker is separately preparing to reline a blast furnace at its Burns Harbor facility in Indiana in 2027, which will likely cost hundreds of millions of dollars.
Cliffs’ new plan for Middletown also include installing a cogeneration plant with four industrial boilers that would primarily burn blast furnace gas — a by-product of ironmaking that is otherwise flared — to supply high-pressure steam and drive turbines that can generate about 70 megawatts of net electricity for use at the steel mill. The company already produces power this way at its Burns Harbor and Indiana Harbor sites, which get 75% and 100% of their electricity from by-product gases, respectively.
Cliffs isn’t the first to contemplate cogeneration for the Middletown mill. AK Steel, which owned the site before Cliffs acquired the company in 2020, considered installing such a system in 2010, which would have also harnessed blast furnace gas to produce electricity and steam. But AK Steel and its partner, Air Products, later determined their $315 million project wasn’t economically viable and canceled it in 2012.
It’s hard to say how the latest plan will affect the significant amounts of carbon dioxide and air pollution that stem from the Middletown facility. Among more than 600 major emitters in Ohio, the steel mill ranked ninth for its output of ozone-causing and lung-irritating nitrogen oxides (NOx) and health-harming particulate matter (PM2.5), according to a 2024 analysis by the decarbonization advocacy group Industrious Labs.
The new cogeneration plant will improve the mill’s energy efficiency, according to Cliffs. It should also offset greenhouse gas emissions that otherwise would have been released by buying electricity from the grid.
Still, in its filings, Cliffs indicated that Middletown could possibly see elevated emissions of NOx, PM2.5 and other pollutants, owing largely to the increased use of its renovated blast furnace.
The overall plan might ultimately be more financially feasible for the steelmaker than a dramatic overhaul in its operations. But the newer projects fall far short of what might have been achieved under Cliffs’ initial DOE grant proposal, said Ariana Criste, the deputy communications director for Industrious Labs.
“This was supposed to be a blueprint for how the industry can move beyond coal and transition an existing facility, without leaving its workers behind,” she said.
The world is in a state of climate emergency, the head of the United Nations declared Sunday, following the release of the latest State of the Global Climate report from the World Meteorological Organization.
“Earth is being pushed beyond its limits while every key climate indicator is flashing red,” said U.N. Secretary-General António Guterres. “Earth’s energy imbalance, the gap between heat absorbed and heat released, is the highest on record. Our planet is trapping heat faster than it can shed it.”
The consequences, he added, “are written into the daily lives of families struggling as droughts and storms drive up food prices, in workers pushed to the brink by extreme heat, in farmers watching crops wither, and in communities and homes swept away by floods.”
The report highlights the significance of record-high concentrations of greenhouse gases in the atmosphere and notes that the effects are visible everywhere, from the 11-year series of hottest-ever years to the way heat is accumulating deep in the oceans. For the first time, it includes a metric called Earth’s energy imbalance as a key climate indicator, measuring the rate at which energy from the sun enters and leaves the planet.
In a stable climate, incoming energy and outgoing energy are about the same. But activities such as burning fossil fuels, growing food and making steel, cement and plastic have upset that balance by pushing levels of heat-trapping carbon dioxide, methane and nitrous oxide in the atmosphere to the highest level in at least 800,000 years. That’s trapping more of the sun’s energy in the Earth’s climate system than ever previously recorded.
“Improved scientific understanding of Earth’s energy imbalance shows the disruption is real and the reality facing our planet and climate right now,” said World Meteorological Organization Secretary-General Celeste Saulo, adding that, “We will live with these consequences for hundreds and thousands of years.”
The new metric shows a more complete picture of how the climate system is responding to human emissions by integrating all the heat accumulating in the oceans and atmosphere, on land and melting ice, said oceanographer Karina von Schuckmann, a senior science adviser with Mercator Ocean International and member of the WMO’s ocean observations panel.
U.S. climate scientist Ko Barrett, deputy secretary-general of the WMO, said Earth’s energy imbalance also helps show how different parts of the climate system are connected and identifies the central role of the oceans in absorbing most of the trapped heat.
The energy balance indicator highlighted by the WMO focuses on the fundamentals of climate change, said independent climate analyst Leon Simons, who co-authored several recent papers on the topic.
“Energy coming in, energy going out,” he said. “Greenhouse gases change how much energy escapes, and the system responds. That’s really what’s driving everything.”
That basic energy measurement is a better starting point than trying to establish temperature change relative to 1850 in international forums, which then quickly start quibbling over what a tenth of a degree means, Simons said. The measurement is also more significant now because there are 20 to 25 years of data from satellite sensors designed to study Earth’s energy balance.
Science basics also help explain one of the report’s most memorable conclusions. The air temperature people experience is only about 1 to 2 percent of all the energy trapped in the Earth’s systems by greenhouse gases. About 90 to 93 percent heats the oceans while about 5 to 6 percent melts ice and heats land.
The WMO report is compiled with input from national weather agencies, international research programs and U.N. partners, drawing on data from satellites, ocean monitoring systems and weather stations worldwide. It reflects contributions from scientists and institutions across nearly 190 countries.
The information reflects the best available global science, despite concerns during the past year about cuts to U.S. climate programs, said Barrett, the WMO deputy and formerly a veteran leader of U.S. federal climate programs across several presidential administrations.
Critical data flows and climate observations have not been disrupted by any of the major contributors to the report, and she noted that Congress has restored “a lot of the funding” previously reported as having been cut. There also has been no decline in demand for accurate climate information, she added.
Guterres said that climate stress is exposing the fact that “our addiction to fossil fuels is destabilizing both the climate and global security.” Accelerating a global transition to renewable energy would “ deliver climate security, energy security and national security,” he said.
“Today’s report should come with a warning label,” he said. “Climate chaos is accelerating and delay is deadly. The way ahead must be grounded in science, common sense and the courage to act.”
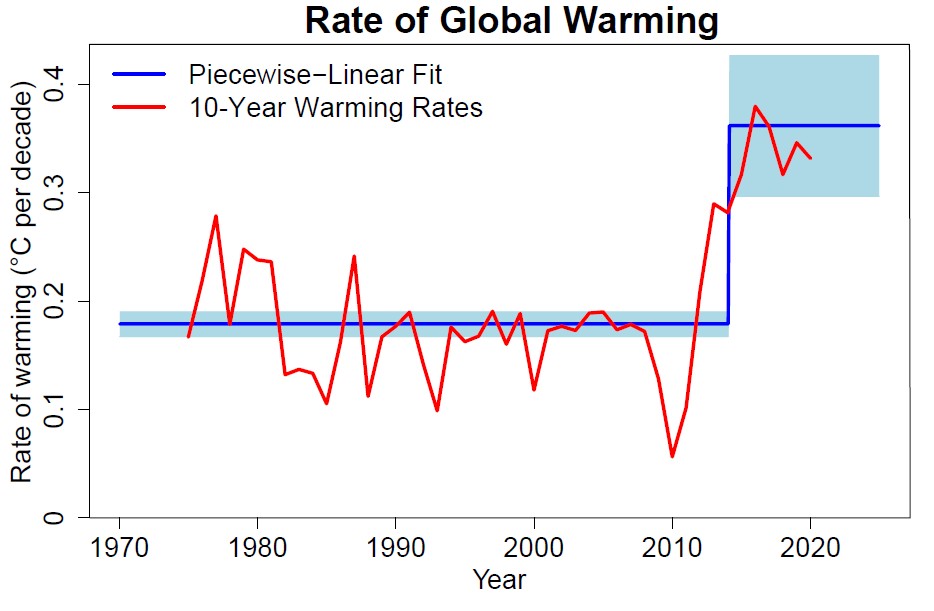
06.03.2026 - Global warming has accelerated since 2015, according to a new study by the Potsdam Institute for Climate Impact Research (PIK). After accounting for known natural influences on global temperature, the research team detected a statistically significant acceleration of the warming trend for the first time. Over the past ten years, the estimated warming rate has been around 0.35°C per decade, depending on the dataset, compared with just under 0.2°C per decade on average from 1970 to 2015. This recent rate is higher than in any previous decade since the beginning of instrumental records in 1880.
“We can now demonstrate a strong and statistically significant acceleration of global warming since around 2015,” says Grant Foster, a US statistics expert and co-author of the study, which was published today in the scientific journal Geophysical Research Letters.
“We filter out known natural influences in the observational data, so that the ‘noise’ is reduced, making the underlying long-term warming signal more clearly visible,” Foster added.
Short-term natural fluctuations in global temperature caused by El Niño, volcanic eruptions, and solar cycles can mask changes in the long-term rate of warming. In their data analysis, which is based on measurement data, the two researchers work with five large, established global temperature data sets (NASA, NOAA, HadCRUT, Berkeley Earth, ERA5).
“The adjusted data show an acceleration of global warming since 2015 with a statistical certainty of over 98 percent, consistent across all data sets examined and independent of the analysis method chosen,” explains Stefan Rahmstorf, PIK researcher and lead author of the study.
After correcting for the effects of El Niño and the solar maximum, 2023 and 2024, which were exceptionally warm years, become somewhat cooler, but remain the two warmest years since the beginning of instrumental records. In all datasets, the acceleration begins to become apparent in 2013 or 2014. To test whether the warming rate has changed since the 1970s, the research team applied two statistical approaches: a quadratic trend analysis and a piecewise linear model that objectively determines the timing of any change in the warming rate.
The study does not investigate the specific causes of the observed acceleration. However, climate models show that an increasing rate of warming is fundamentally within the scope of current climate modelling, according to the authors.
“If the warming rate of the past 10 years continues, it would lead to a long-term exceedance of the 1.5° limit of the Paris Agreement before 2030,” says Stefan Rahmstorf. “How quickly the Earth continues to warm ultimately depends on how rapidly we reduce global CO₂ emissions from fossil fuels to zero."
Winter winds lofted clouds of dust from the Sahara Desert, carrying it north toward the Mediterranean and dispersing it widely across Europe in March 2026. When the dust combined with moisture-laden weather systems, a dirty rain fell in parts of Spain, France, and the United Kingdom.
This animation highlights the concentration and movement of dust throughout the region from March 1 to March 9. It depicts dust column mass density—a measure of the amount of dust contained in a column of air—produced with a version of the GEOS (Goddard Earth Observing System) model. The model integrates satellite data with mathematical equations that represent physical processes in the atmosphere.
The animation shows dust plumes originating in northwestern Africa being blown both to the west across the Atlantic Ocean and north toward the Mediterranean. As plumes spread throughout Western Europe over several days, people observed hazy skies from southern England, where sunrises and sunsets took on an eerie glow, to the Alps in Switzerland and Italy, where a dust layer encroached on the Matterhorn.
Not all of the dust remained aloft. Storms encountered some of the dust, causing particles to fall to the ground with rain and coat surfaces with a brownish residue. A low-pressure system, named Storm Regina by Portugal’s weather service, moved across the Iberian Peninsula and brought so-called blood rain to southern and eastern Spain, along with parts of France and the southern UK in early March, according to news reports.
Over the Mediterranean, areas of “dusty cirrus” clouds developed higher in the atmosphere, where dust particles can act as condensation nuclei for ice crystals, according to MeteoSwiss, Switzerland’s Federal Office for Meteorology and Climatology. Scientists are studying these clouds to better understand their formation and how they affect weather, climate, and even solar power generation.
In a new analysis, researchers used NASA’s MERRA-2 (Modern-Era Retrospective Analysis for Research and Applications, Version 2), observations from MODIS (Moderate Resolution Imaging Spectroradiometer), and other satellite products to parse the effect of airborne Saharan dust on solar power in Hungary. They found that photovoltaic performance dropped to 46 percent on high-dust days, compared with 75 percent or more on low-dust days. They determined the greatest losses occurred because dust enhanced the presence and reflectance of cirrus clouds and reduced the amount of radiation that reached solar panels.
Some research suggests more frequent and intense wintertime dust events have affected Europe in recent years. Researchers have proposed several factors contributing to these outbreaks, including drier-than-normal conditions in northwestern Africa and weather patterns more often driving winds north from the Sahara.
NASA Earth Observatory animation by Lauren Dauphin, using GEOS-FP data from the Global Modeling and Assimilation Office at NASA GSFC. Story by Lindsey Doermann.
This article originally appeared on Inside Climate News(hyperlink to the original story), a nonprofit, non-partisan news organization that covers climate, energy and the environment. Sign up for their newsletter here.
U.S. Sen. Sheldon Whitehouse (D-RI) launched an investigation into the discrepancy between reported and observed methane pollution from the Permian Basin—the largest-producing oil field in the United States and one of the largest in the world.
The investigation, announced Wednesday, follows a recent report by MethaneSAT, a short-lived methane-sensing satellite launched by the Environmental Defense Fund, Harvard University and others in 2024. That report, released in early February, found that methane emissions from oil and gas production facilities in the Permian Basin from May 2024 to June 2025 were four times higher than the U.S. Environmental Protection Agency’s official estimates.
“The inconsistency between emissions reported to EPA’s Greenhouse [Gas] Inventory and satellite data suggest that significant, previously unreported emissions may be occurring,” Whitehouse, the ranking member of the Senate Environment and Public Works Committee, said in a written statement. As a result, “substantial opportunities exist to reduce waste, improve operational efficiency, and mitigate climate change.”
Methane is a climate super-pollutant. Over 80 times more effective at warming the planet than carbon dioxide in the first two decades after its release, it is the second-leading driver of climate change. Its emissions also pose serious public health risks, contribute to smog formation and negatively impact agricultural production.
Whitehouse requested information by April 1 from eight leading oil and gas producers in the Permian Basin of West Texas and southeastern New Mexico—EOG Resources, ConocoPhillips, Occidental Petroleum, ExxonMobil, Diamondback Energy, Devon Energy, Chevron and Mewbourne Oil Company. The senator asked each company about the steps they are taking to address methane pollution in the region, how they monitor and measure their own emissions and their current estimates.
“We appreciate the Senator’s interest in this important topic and look forward to working with him to achieve our shared goal of increasing global supplies of natural gas and reducing cost for consumers and industry,” Allison Cook, a spokesperson for Chevron, said in an email.
A spokesperson for EOG Resources shared the company’s 2024 sustainability report, which noted a low rate of methane emissions, 0.04 percent of total U.S. gas production.
None of the other companies responded to a request for comment from Inside Climate News.
A spokesperson for S&P Global Energy, a research firm that focuses on energy, commodities and financial information, said the discrepancy relates to how the EPA requires emissions data to be reported. An S&P Global report published last year concluded methane emissions from the Permian Basin declined by nearly 20 percent from 2022 to 2024 as oil and gas production grew.
Sharon Wilson, executive director of the nonprofit organization Oilfield Witness, which uses optical gas imaging cameras to reveal emissions of methane and other pollutants in the Permian Basin and elsewhere, cautioned that the S&P Global report had not undergone the peer-review process customary for studies published in academic journals.
MethaneSAT’s findings hadn’t been confirmed through a peer-reviewed study published in an academic journal at the time of their release in February. However, a MethaneSAT study that includes data from the Permian is currently under review by the journal EGUsphere.
Steven Hamburg, chief scientist at the Environmental Defense Fund and MethaneSAT project lead, said emissions from the region are “very large” and the intensity, or rate of emissions, exceeds industry targets for emission reductions.
“Bottom line emissions are far too high, and it is technically and economically feasible to reduce emissions drastically,” Hamburg said in a written statement.
Two of the companies questioned by Whitehouse, ExxonMobil and Occidental Petroleum, have pledged to reduce methane emissions to 0.2 percent of total gas brought to market by 2030 under the Oil and Gas Decarbonization Charter, a voluntary industry group. MethaneSAT reported a significantly higher rate of emissions—2.4 percent of total marketed gas—for the entire Permian Basin.
A spokesperson for the Oil and Gas Decarbonization Charter did not respond to a request for additional information other than providing a link to the group’s 2025 annual report.
All of the companies except Mewbourne Oil are members of the Oil and Gas Methane Partnership 2.0, a global emissions-reduction program for oil and gas companies overseen by the United Nations Environment Programme (UNEP). Member companies commit to an individual methane reduction target, based either on absolute emissions volume or methane intensity.
A UNEP spokesperson said they support measurement data provided by efforts such as MethaneSAT. “The transparency provided by this data is essential for industry to effectively manage emissions and for consumers, investors and others to make informed decisions,” the spokesperson said in an email.
In a press release announcing the investigation, Whitehouse stated that reducing methane emissions “can largely be done at no net cost.” Methane is the primary component of natural gas, a valuable commodity whose price has spiked due to the ongoing U.S.-Israel war in Iran.
Wilson challenged the notion of reducing emissions at little to no cost, noting that methane is considered a byproduct in the Permian Basin and that a significant buildout of additional infrastructure, along with increased equipment maintenance, would be needed. Oil is the primary commodity in the region. Pipelines needed to bring gas to market are often insufficient, resulting in a large volume of gas being flared rather than sold.
Wilson emphasized that producing oil and gas inevitably releases pollution, and permitting new sites will lead to elevated levels.
Whitehouse said stronger federal oversight is needed.
“Fossil fuel companies can’t be trusted to control their dangerous methane leakage,” he said. “There’s a significant discrepancy between reported and tracked methane emissions in the Permian Basin that demands further investigation.”
The article was originally published by Earthobservatory.nasa.gov
August 21, 2025

September 6, 2025
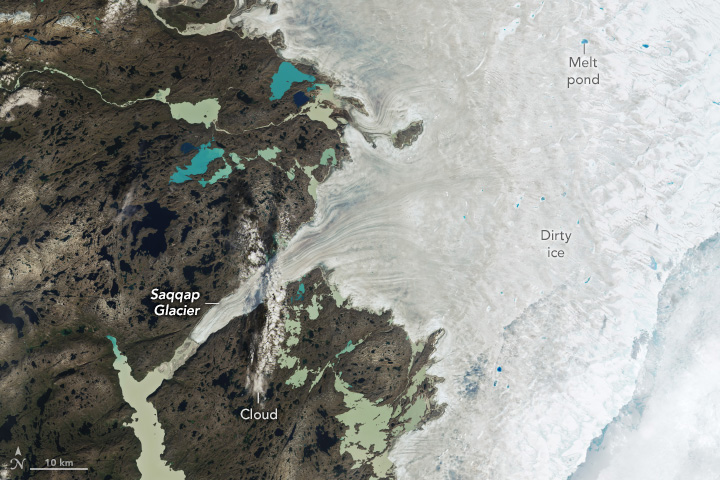
Ice covers about 1.7 million square kilometers (656,000 square miles) of Greenland, forming the largest ice sheet on Earth outside of Antarctica. Each summer, its surface begins to melt under the warmth of the Sun, intensified by the season’s long daylight hours and sometimes further enhanced by clouds and rain.
Greenland’s melting season usually runs from May to early September. The 2025 season was considered “moderately intense,” ranking 19th in the 47-year satellite record for cumulative daily melt area as of late August, according to an analysis by the National Snow and Ice Data Center (NSIDC). This year’s season featured an extended period of melting in part of July and a sharp increase in warmth and melting in mid-August.
The mid-August spike, which was preceded by significant rainfall in some areas, peaked on August 21, when melting was observed across nearly 35 percent of the ice sheet—a record for that date, according to the NSIDC. These satellite images show the ice sheet on that day (left) and nearly two weeks later (right), along part of its southwestern edge about 150 kilometers (90 miles) northeast of the capital city of Nuuk (not shown). Both images were captured by the OLI-2 (Operational Land Imager-2) on Landsat 9.
In the August image, a vast expanse of gray, “dirty” ice is visible. The darker appearance is due to particles like black carbon and dust that have accumulated on the ice sheet. As the snow and ice melt, these impurities are left behind, making the ice appear even darker. This darkening reduces the ice’s albedo—its ability to reflect sunlight—causing it to absorb more solar energy and melt even faster during the summer months. Several ponds of light- and deep-blue meltwater dot the ice, and scattered clouds cover part of the ice sheet in the middle and bottom-right of the scene.
By the date of the September image, a fresh layer of snow appears to cover much of the dirty ice as well as some of the land. While major melt events have occurred as late as September in previous years, they become less likely this time of year as temperatures typically drop with the Arctic’s diminishing daylight.
Scientists track seasonal melting each year because it is one of the ways the massive Greenland Ice Sheet loses ice. (Iceberg calving and melting at the base of tidewater glaciers also play a role.) As air and water temperatures have risen in recent decades, ice losses have outpaced ice gains, contributing to sea level rise.
NASA Earth Observatory images by Wanmei Liang, using Landsat data from the U.S. Geological Survey. Story by Kathryn Hansen.

By measuring the gravitational pull of water for more than two decades, NASA satellites have peered beneath the surface and measured changes in the groundwater supplies of the Colorado River Basin. In a recent analysis of the satellite data, Arizona State University researchers reported rapid and accelerating losses of groundwater in the basin’s underground aquifers between 2002 and 2024. Some 40 million people rely on water from the aquifers, which include parts of Arizona, California, Colorado, Nevada, New Mexico, Utah, and Wyoming.
The basin lost about 27.8 million acre-feet of groundwater during the study period. “That’s an amount roughly equal to the storage capacity of Lake Mead,” said Karem Abdelmohsen, an associate research scientist at Arizona State University who authored the study.
About 68 percent of the losses occurred in the lower part of the basin, which lies mostly in Arizona. The research is based on data collected by the GRACE (Gravity Recovery and Climate Experiment) and GRACE-FO (GRACE Follow-On) missions. The data were integrated with output from land surface models, such as NASA’s North American Land Data Assimilation System, and in-situ precipitation data to calculate groundwater losses.
The conclusions were similar to those arrived at by Arizona State University Global Futures Professor Jay Famiglietti in an analysis of the Colorado River Basin published in 2014, when his team was at the University of California, Irvine. "If left unmanaged for another decade, groundwater levels will continue to drop, putting Arizona’s water security and food production at far greater risk than is being acknowledged,” said Famiglietti, previously a senior water scientist at NASA’s Jet Propulsion Laboratory and the principal investigator of both studies.
The maps above underscore the accelerating rate of groundwater loss detected by the GRACE missions. In the first decade of the analysis, between 2002 and 2014, parts of the basin in western Arizona in La Paz and Mohave counties and in southeastern Arizona in Cochise County lost groundwater at a rate of about 5 millimeters (0.2 inches) per year. Between 2015 and 2024, the rate of groundwater loss more than doubled to 12 millimeters (0.5 inches) per year.

Two key factors likely explain the acceleration, the researchers said. First, there was a global transition from one of the strongest El Niños on record in 2014-2016 to a period when La Niña reasserted control, including the arrival of a “triple-dip” La Niña between 2020 and 2023. La Niña typically shifts winter precipitation patterns in a way that reduces rainfall over the Southwest and slows the replenishment of aquifers.
Second, there was an increase in the amount of groundwater being used for agriculture. “2014 was about the time that industrial agriculture took off in Arizona,” Famiglietti said, noting that large alfalfa farms arrived in La Paz and other parts of southern Arizona around that time. Dairies and orchards in southeastern Arizona likely impacted groundwater supplies as well, he added. Other “thirsty” crops grown widely in the state include cotton, corn, and pecans. Data from the U.S. Department of Agriculture’s Cropland Data Layer (CDL) shows that these crops are common in several parts of southern Arizona, including Maricopa, Pinal, and Cochise counties.
Irrigated agriculture consumes about 72 percent of Arizona’s available water supply; cities and industry account for 22 percent and 6 percent, respectively, according to Arizona Department of Water Resources data. Many farms use what Famiglietti described as “vast” amounts of groundwater in part because they use a water-intensive type of irrigation known as flood irrigation (or sometimes furrow irrigation), a technique where water is released into trenches that run through crop fields. The long-standing practice is typically the cheapest option and is widely used for alfalfa and cotton, but it can lead to more water loss and evaporation than other irrigation techniques, such as overhead sprinklers or dripping water from plastic tubing.
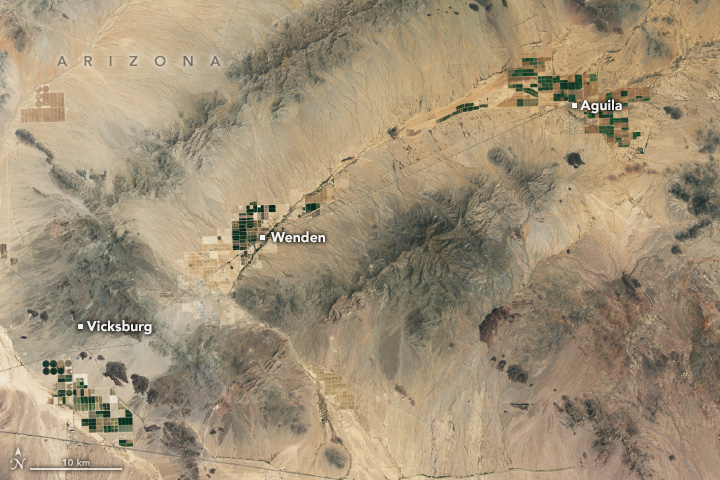
The satellite image above, captured by the OLI (Operational Land Imager) on Landsat 8, shows desert agriculture in La Paz and Maricopa counties on July 12, 2025. CDL data from the U.S. Department of Agriculture indicates that most of the rectangular fields around Vicksburg and Wenden are used to grow alfalfa, while the fields around Aguila are typically used for fruits and vegetables, such as melons, broccoli, and leafy greens. Some of the alfalfa fields in Butler Valley (upper part of the image) have gone fallow in recent years following the termination of leases due to concerns from the Arizona State Land Department about groundwater pumping.
The new analysis found some evidence that managing groundwater can help keep Arizona aquifers healthier. For instance, the active management areas and irrigation non-expansion areas established as part of the Arizona Groundwater Management Act of 1980 lessened water losses in some areas. The designation of a new active management area in the Willcox Basin in 2025 will likely further slow groundwater losses. “Still, the bottom line is that the losses to groundwater were huge,” Abdelmohsen said. “Lots of attention has gone to low water levels in reservoirs over the years, but the depletion of groundwater far outpaces the surface water losses. This is a big warning flag.”
NASA supports several missions, tools, and datasets relevant to water resource management. Among them is OpenET, a web-based platform that uses satellite data to measure how much water plants and soils release into the atmosphere. The tool can help farmers tailor irrigation schedules to actual water use by plants, optimizing “crop per drop” and reducing waste.
NASA Earth Observatory images by Wanmei Liang, using data from Abdelmohsen, K., et al. (2025), boundary data from Colorado River Basin GIS Open Data Portal, and Landsat data from the U.S. Geological Survey. Oceanic Niño Index chart based on data from the Climate Prediction Center at NOAA. Story by Adam Voiland.
Figure 1. Heat Content in the Top 700 Meters of the World's Oceans, 1955–2023
This figure shows changes in heat content of the top 700 meters of the world’s oceans between 1955 and 2023. Ocean heat content is measured in joules, a unit of energy, and compared against the 1971–2000 average, which is set at zero for reference. Choosing a different baseline period would not change the shape of the data over time. The lines were independently calculated using different methods by government organizations in four countries: the United States’ National Oceanic and Atmospheric Administration (NOAA), Australia’s Commonwealth Scientific and Industrial Research Organisation (CSIRO), China’s Institute of Atmospheric Physics (IAP), and the Japan Meteorological Agency’s Meteorological Research Institute (MRI/JMA). For reference, an increase of 1 unit on this graph (1 × 10²² joules) is equal to approximately 17 times the total amount of energy used by all the people on Earth in a year (based on a total global energy supply of 606 exajoules in the year 2019, which equates to 6.06 × 10²⁰ joules).4
Data sources: CSIRO, 2024;5 IAP, 2024;6 MRI/JMA, 2024;7 NOAA, 2024
Web update: June 2024

Figure 2. Heat Content in the Top 2,000 Meters of the World’s Oceans, 1955–2023
This figure shows changes in heat content of the top 2,000 meters of the world’s oceans between 1955 and 2023. Ocean heat content is measured in joules, a unit of energy, and compared against the 1971–2000 average, which is set at zero for reference. Choosing a different baseline period would not change the shape of the data over time. The lines were independently calculated using different methods by government organizations in three countries: the United States’ National Oceanic and Atmospheric Administration (NOAA), China’s Institute of Atmospheric Physics (IAP), and the Japan Meteorological Agency’s Meteorological Research Institute (MRI/JMA). For reference, an increase of 1 unit on this graph (1 × 10²² joules) is equal to approximately 17 times the total amount of energy used by all the people on Earth in a year (based on a total global energy supply of 606 exajoules in the year 2019, which equates to 6.06 × 10²⁰ joules).4
Data sources: IAP, 2024;6 MRI/JMA, 2024;7 NOAA, 20248
Web update: June 2024
When sunlight and energy trapped by greenhouse gases reach the Earth’s surface, the world’s oceans absorb some of this energy and store it as heat. This heat is initially absorbed at the surface, but some of it eventually spreads to deeper waters. Currents also move this heat around the world. Water has a much higher heat capacity than air, meaning the oceans can absorb larger amounts of heat energy with only a slight increase in temperature.
The total amount of heat stored by the oceans is called “ocean heat content,” and measurements of water temperature reflect the amount of heat in the water at a particular time and location. Ocean temperature plays an important role in the Earth’s climate system—particularly sea surface temperature (see the Sea Surface Temperature indicator)—because heat from ocean surface waters provides energy for storms and thereby influences weather patterns.
Increasing greenhouse gas concentrations are trapping more energy from the sun. Because changes in ocean systems occur over centuries, the oceans have not yet warmed as much as the atmosphere, even though they have absorbed more than 90 percent of the Earth’s extra heat over the last half-century,1 and even as the rate of ocean heat uptake has doubled since 1993.2 If not for the large heat-storage capacity provided by the oceans, the atmosphere would warm more rapidly.3 Increased heat absorption also changes ocean currents because many currents are driven by differences in temperature, which cause differences in density. These currents influence climate patterns and sustain ecosystems that depend on certain temperature ranges.
Because water expands slightly as it gets warmer, an increase in ocean heat content will also increase the volume of water in the ocean, which is one of the major causes of the observed increases in sea level (see the Sea Level indicator). For all these reasons, ocean heat content is one of the most important indicators tracking the causes and responses of a changing climate.
This indicator shows trends in global ocean heat content from 1955 to 2023. Measurement data are available for the top 2,000 meters (nearly 6,600 feet) of the ocean, which accounts for nearly half of the total volume of water in the world’s oceans. This indicator also shows changes representative of the top 700 meters (nearly 2,300 feet) of the world’s oceans, where much of the observed warming has taken place. The indicator measures ocean heat content in joules, which are units of energy.
Organizations around the world have calculated changes in ocean heat content based on measurements of ocean temperatures at different depths. These measurements come from a variety of instruments deployed from ships and airplanes and, more recently, underwater robots. Thus, the data must be carefully adjusted to account for differences among measurement techniques and data collection programs. Figure 1 shows four independent interpretations of essentially the same underlying data for the top 700 meters of the ocean, and Figure 2 shows three independent interpretations for the top 2,000 meters of the ocean.
Data must be carefully reconstructed and filtered for biases because of different data collection techniques and uneven sampling over time and space. Various methods of correcting the data have led to slightly different versions of the ocean heat trend line. Scientists continue to compare their results and improve their estimates over time. They also test their ocean heat estimates by looking at corresponding changes in other properties of the ocean. For example, they can check to see whether observed changes in sea level match the amount of sea level rise that would be expected based on the estimated change in ocean heat.
Data for this indicator were collected by the National Oceanic and Atmospheric Administration (NOAA) and other organizations around the world. The data were analyzed independently by researchers at NOAA, Australia’s Commonwealth Scientific and Industrial Research Organisation, China’s Institute of Atmospheric Physics, and the Japan Meteorological Agency’s Meteorological Research Institute.
1 IPCC (Intergovernmental Panel on Climate Change). (2021). Climate change 2021—The physical science basis: Working Group I contribution to the Sixth Assessment Report of the Intergovernmental Panel on Climate Change (V. Masson-Delmotte, P. Zhai, A. Pirani, S. L. Connors, C. Péan, S. Berger, N. Caud, Y. Chen, L. Goldfarb, M. I. Gomis, M. Huang, K. Leitzell, E. Lonnoy, J. B. R. Matthews, T. K. Maycock, T. Waterfield, O. Yelekçi, R. Yu, & B. Zhou, Eds.). Cambridge University Press. https://doi.org/10.1017/9781009157896
2 IPCC (Intergovernmental Panel on Climate Change). (2019). Summary for policymakers. In The ocean and cryosphere in a changing climate: Special report of the Intergovernmental Panel on Climate Change. Cambridge University Press. https://doi.org/10.1017/9781009157964.001
3 Levitus, S., Antonov, J. I., Boyer, T. P., Baranova, O. K., Garcia, H. E., Locarnini, R. A., Mishonov, A. V., Reagan, J. R., Seidov, D., Yarosh, E. S., & Zweng, M. M. (2012). World ocean heat content and thermosteric sea level change (0–2000 m), 1955–2010. Geophysical Research Letters, 39(10), 2012GL051106. https://doi.org/10.1029/2012GL051106
4 IEA (International Energy Agency). (2021). Key world energy statistics 2021. www.iea.org/reports/key-world-energy-statistics-2021
5 CSIRO (Commonwealth Scientific and Industrial Research Organization) (2024). Update to data originally published in Domingues, C. M., Church, J. A., White, N. J., Gleckler, P. J., Wijffels, S. E., Barker, P. M., & Dunn, J. R. (2008). Improved estimates of upper-ocean warming and multi-decadal sea-level rise. Nature, 453(7198), 1090–1093. https://doi.org/10.1038/nature07080
6 IAP (Institute of Atmospheric Physics). (2024). Update to data originally published in Cheng, L., Trenberth, K. E., Fasullo, J., Boyer, T., Abraham, J., & Zhu, J. (2017). Improved estimates of ocean heat content from 1960 to 2015. Science Advances, 3(3), e1601545. https://doi.org/10.1126/sciadv.1601545
7 MRI/JMA (Meteorological Research Institute/Japan Meteorological Agency). (2024). Global ocean heat content. www.data.jma.go.jp/gmd/kaiyou/english/ohc/ohc_global_en.html
8 NOAA (National Oceanic and Atmospheric Administration). (2024). Global ocean heat and salt content: Seasonal, yearly, and pentadal fields. www.nodc.noaa.gov/OC5/3M_HEAT_CONTENT

.svg)
