

U.S. additions to electric generation capacity from 2000 to 2025. The U.S. Energy Information Administration (EIA) reports that the United States
is building power plants at a record pace. As indicated on the chart, nearly all new electric generating capacity either already installed or planned
for 2025 is from clean energy sources, while new power plants coming
on line 25 years ago, in 2000, were predominantly fueled by natural gas. New wind power plants began to come on line in 2001 and new solar plants, 10 years, later in 2011. Since 2023, the U.S. power industry has built more solar than any other type of power plant. The EIA predicts that clean energy (wind, solar, and battery storage) will deliver 93% of new power-plant capacity in 2025.


Global surface air temperature departures between 1940 and 2024 from the average temperature for the period 1991-2020 (averages below the 11-year average are blue and those above are red). The average in October 2024 was +0.80 degrees Celsius above the reference period average, down from +0.85 degrees Celsius above the reference period average in 2023, which was the warmest October on record.
Atmospheric carbon dioxide (CO₂) concentration in preserved air samples from ice cores, in parts per million by volume (ppmv), from 803,719 BCE to 2023. This indicator describes how the levels of CO₂ concentration in the atmosphere have changed over geological time and in recent years. From the first recordings in 803,719 BCE to around 1920, a period of over 805,000 years, CO₂ concentration oscillated between 175 and 300 ppmv. Since then, concentrations increased dramatically to 419 ppmv in 2023, the largest increase in a 100 year period since recordings began. These changes caused, in part, by human activities, affect the amount of energy held in the Earth-atmosphere system and thus affect the Earth's climate.

Historic annual worldwide CO₂ emissions due to fossil fuels and industry from 1750 to 2023. Prior to the Industrial Revolution (1760-1840), worldwide CO₂ emissions were very low and growth in emissions remained slow until the mid-20th century. In 1950 the world emitted 6 billion tonnes of CO₂. By 1990 this had almost quadrupled, reaching more than 23 billion tonnes. Despite a slight dip in 2019, overall emissions continued to increase rapidly, reaching 37.79 billion tonnes in 2023.
Historic annual CO₂ emissions due to fossil fuels and industry for countries within the regions of Asia, North and South America, Europe, and the Middle East from 1750 to 2023.
Prior to the Industrial Revolution (1760-1840), worldwide CO₂ emissions were very low and growth in emissions remained slow until the mid-20th century, after which they began to grow in each region, rising sharply in the mid 20th century.
Since then, Europe and North America have shown decreases. 2023 emissions for Asia were 22.60 billion tonnes, North America were 6.12 billion tonnes, Europe were 4.99 billion tonnes, the Middle East were 2.86, and South America were 1.11 billion tonnes.

Historic annual greenhouse gas (GHG) emissions from fossil fuels, industry, agriculture, and land-use change by gas from 1850 to 2023. In addition to the most well known GHG, carbon dioxide (CO₂), these gases include methane (CH₄) and nitrous oxide (N₂O), each of which cause the atmosphere to warm by absorbing radiant energy. Emissions are measured in billions of tonnes and expressed in “carbon dioxide equivalents” (CO₂eq) determined by multiplying the mass of the emissions of a specific GHG by its global warming potential factor for a 100-year period (GWP100).
Methane (CH₄) emissions from fossil fuels, industry, agriculture, and land-use change for 2023. Emissions are measured in billions of tonnes and expressed in “carbon dioxide equivalents” (CO₂eq) determined by multiplying the mass of the emissions of a specific GHG by its global warming potential factor for a 100-year period (GWP100).
Satellite photos of sea ice in the Arctic Ocean in September 1979 and September 2023. The effects of global warming are evidenced by changes in the extent (the area of ocean where at least 15 percent of the surface is frozen) and thickness of ice formed in the Arctic Ocean. This is mainly due to the ease with which ice changes between solid and liquid states in response to relatively minor changes in temperature.
Arctic sea ice is also affected by the freezing and thawing associated with normal changes in seasonal weather. These photos were taken by NASA satellites during the month of September, at which time the sea ice reaches its minimum extent after the summer thaw and measures roughly half the size of the winter maximum.
US commitment vs actual greenhouse gas (GHG) emissions reduction from 2005 to 2022. As a result of the Paris Agreement, the United States committed to reducing its annual GHG emissions to 50-52% below 2005 levels by 2030. By 2022, the US EPA reports GHG emissions at 84.8% of 2005 levels, 18.8 percentage points above its commitment of 66%, when taken as a straight line.
.png)

NASA scientists and their international partners have been monitoring the causes of sea level rise using satellites, airborne missions, shipboard measurements, and supercomputers for decades. Defined as the increase in average height of the ocean’s surface, global mean sea level rise is primarily caused by two factors related to global warming: 1) the added water from melting ice sheets and glaciers, and 2) the expansion of seawater as it warms.
The graph shows global change in sea level between 1993 and 2024 measured by satellite altimeters. The black line documents the measurements, while the blue line indicates the level of uncertainty that is associated with these measurements. Between 1993 and 2024, the global mean sea level rise was observed to be 103.3 millimeters, or 3.4 millimeters per year. However, over this period the yearly rate of increase has doubled to the current 4.4 millimeters per year.
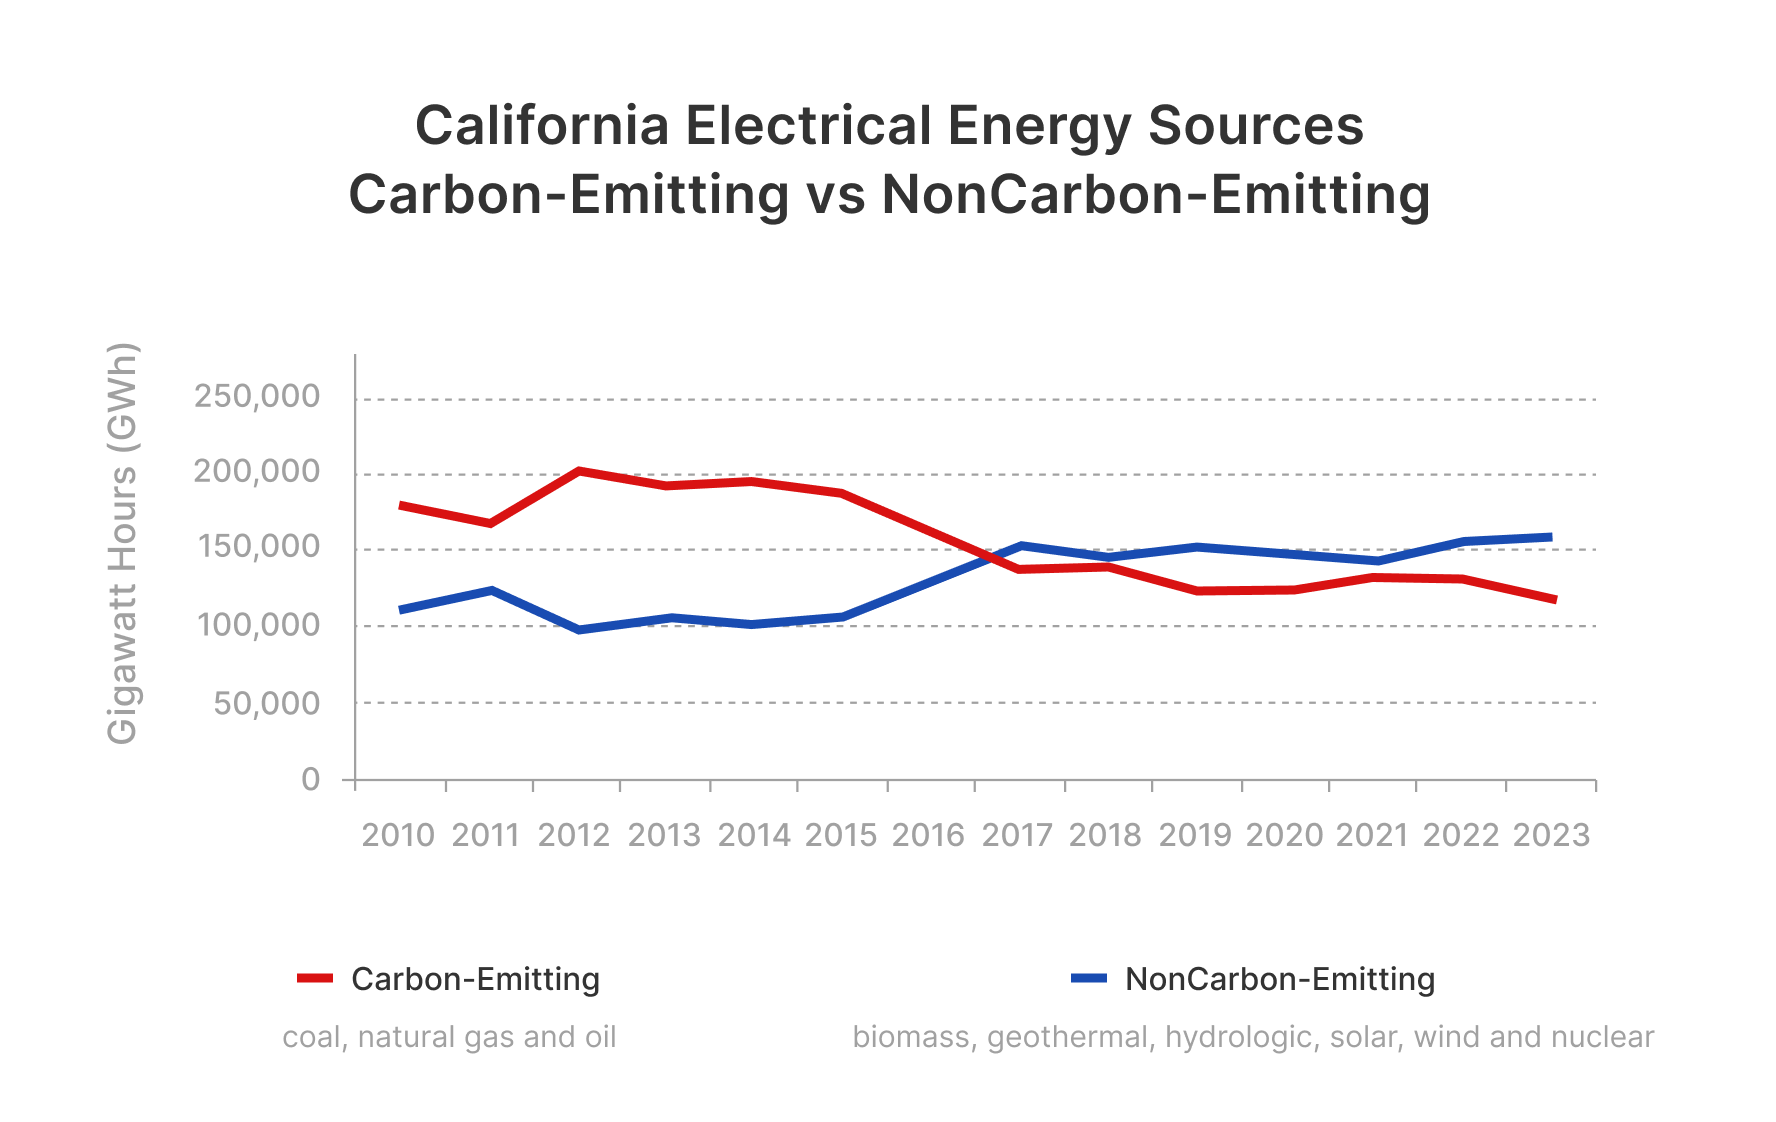
Sources of electrical energy in California from 2010 to 2023. With promulgation of its Renewables Portfolio Standards (RPS) Program, California required increasing sources of clean energy from its providers beginning in 2013. Since then, carbon-emitting sources have been on the decline and have been below noncarbon-emitting sources since 2017.
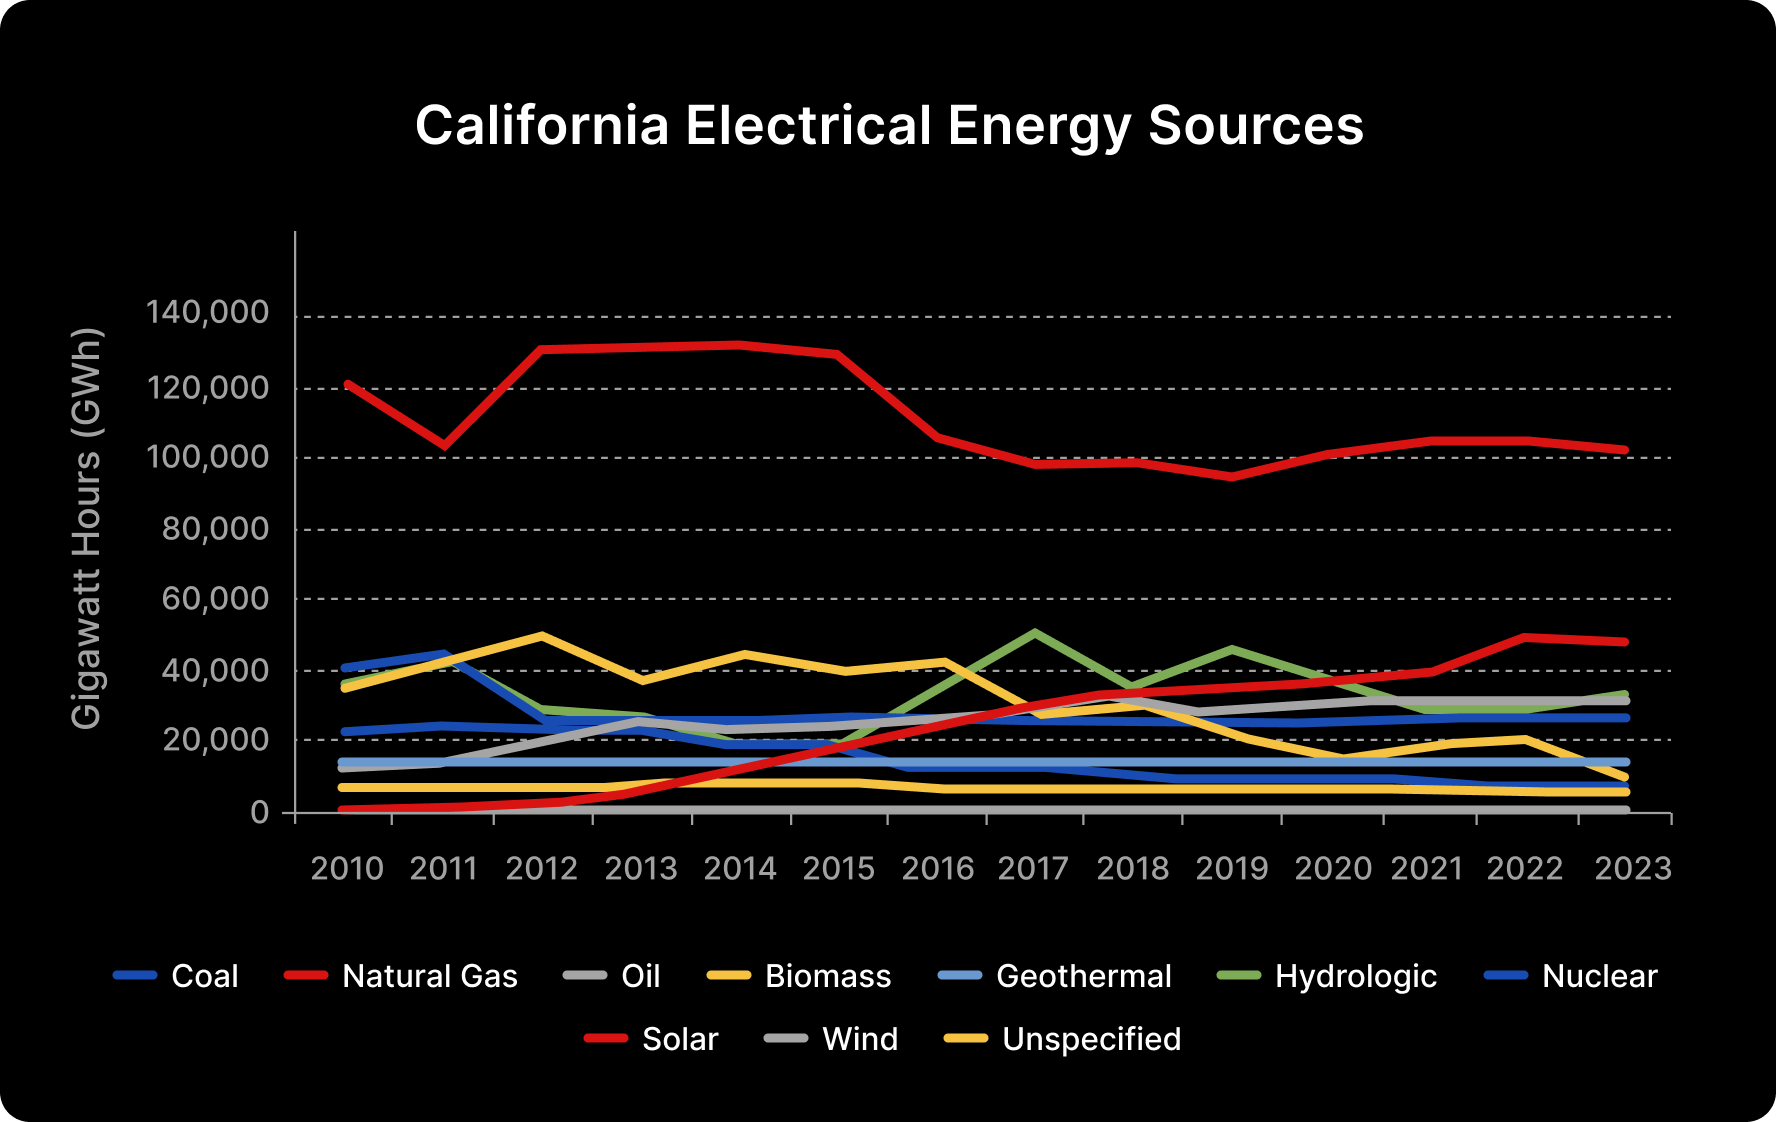
Sources of electrical energy in the state of California from 2010 to 2023. While sources of natural gas decrease from a high of 132,157 gigawatt hours (GWh) in 2014 to 102,781 GWh in 2023, and sources of solar energy increase from 959 GWh in 2010 to 48,155 GWh in 2023, other sources (coal, oil, biomass, geothermal, hydrologic, nuclear, wind, and unspecified) remain largely unchanged throughout the period.
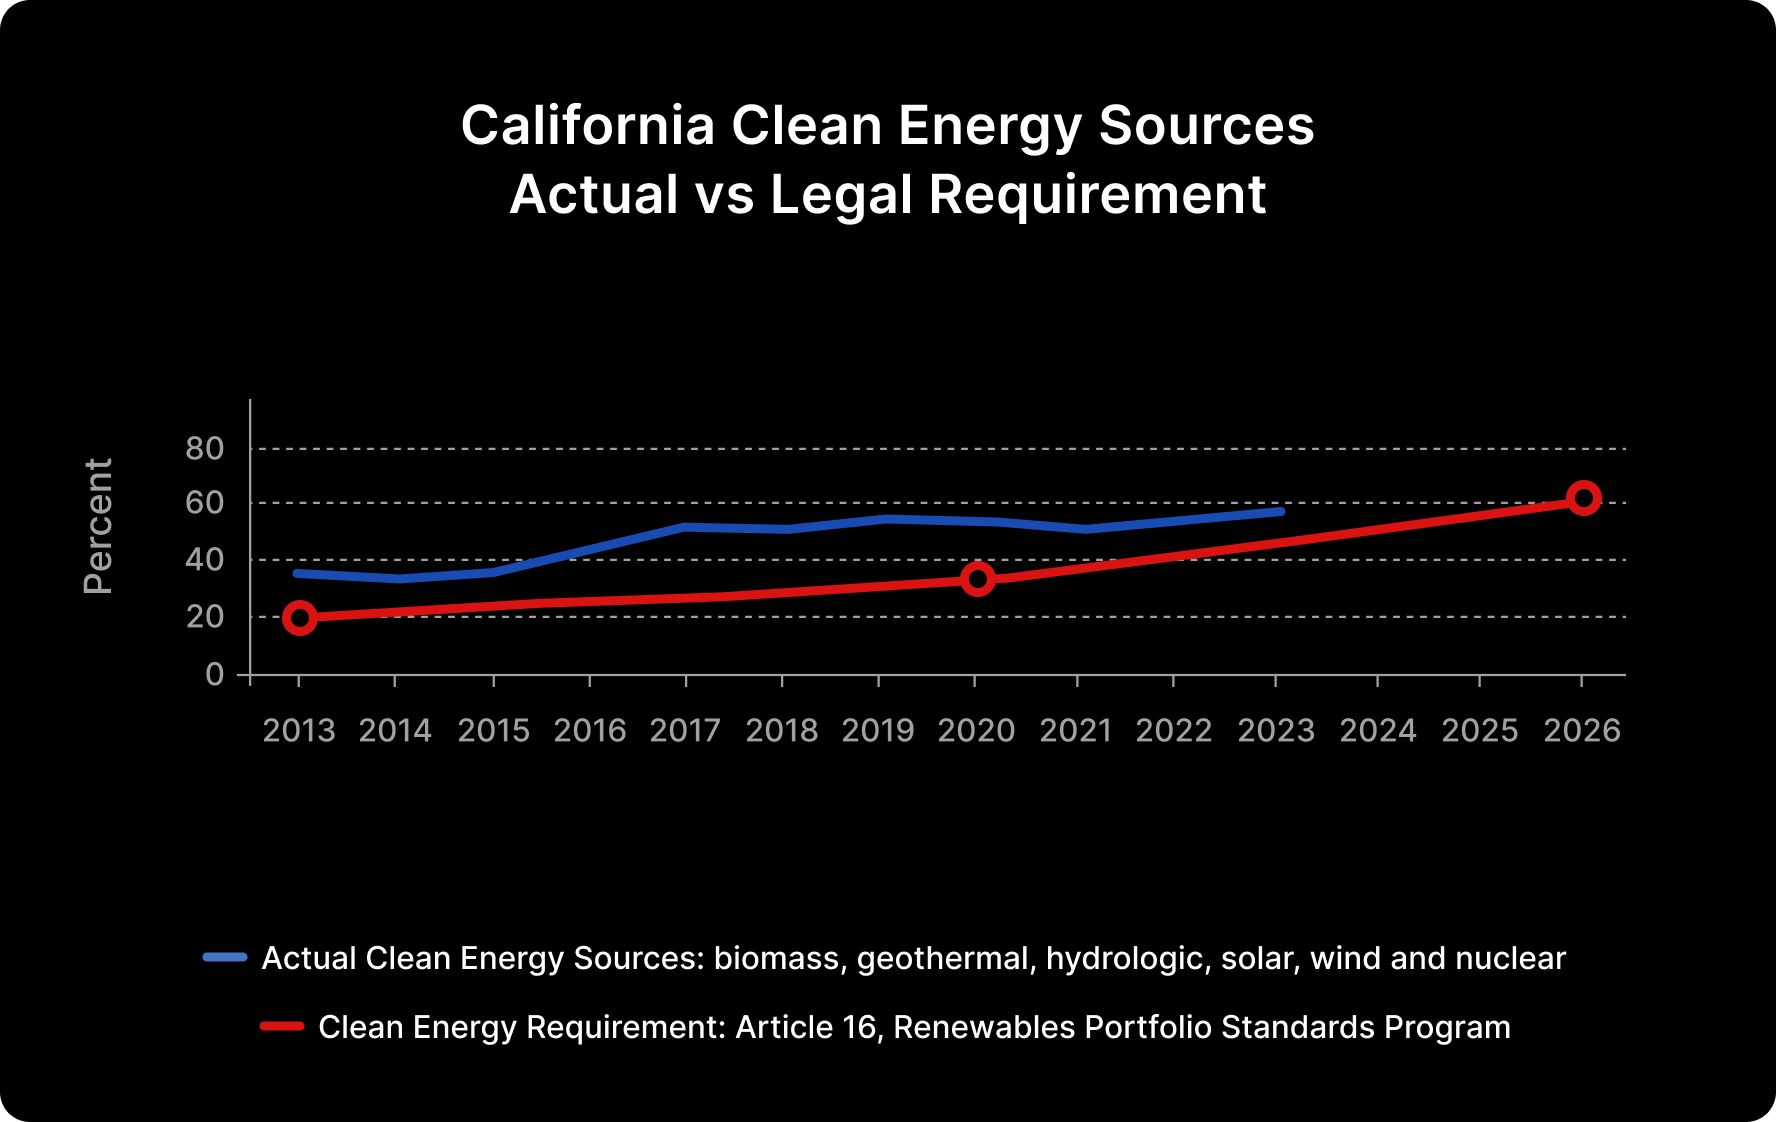
Actual percentages of clean energy sources vs California's legal requirement from 2013 to 2023. California's Renewables Portfolio Standards (RPS) Program requires generation of 20% of its electrical energy to be from clean energy sources by 12/31/2013, 33% by 12/31/2020, 60% by 12/31/2026, and 100% by 2045. Actual clean energy sources have been above the RPS requirement since inception of the RPS Program, reaching 57% in 2023 at which time the requirement for clean energy was 47%.
Historic energy consumption in the United States from 1776-2022. Wood was the dominant source of energy until the mid- to late- 1800s. Coal and natural gas both came into use in the late 19th century until being overtaken by petroleum products in the middle of the 20th century along with a sharp increase in the use of natural gas. Nuclear power began to make a contribution at the same time. The overall pattern of energy usage has remained fairly stable since late in the 20th century.
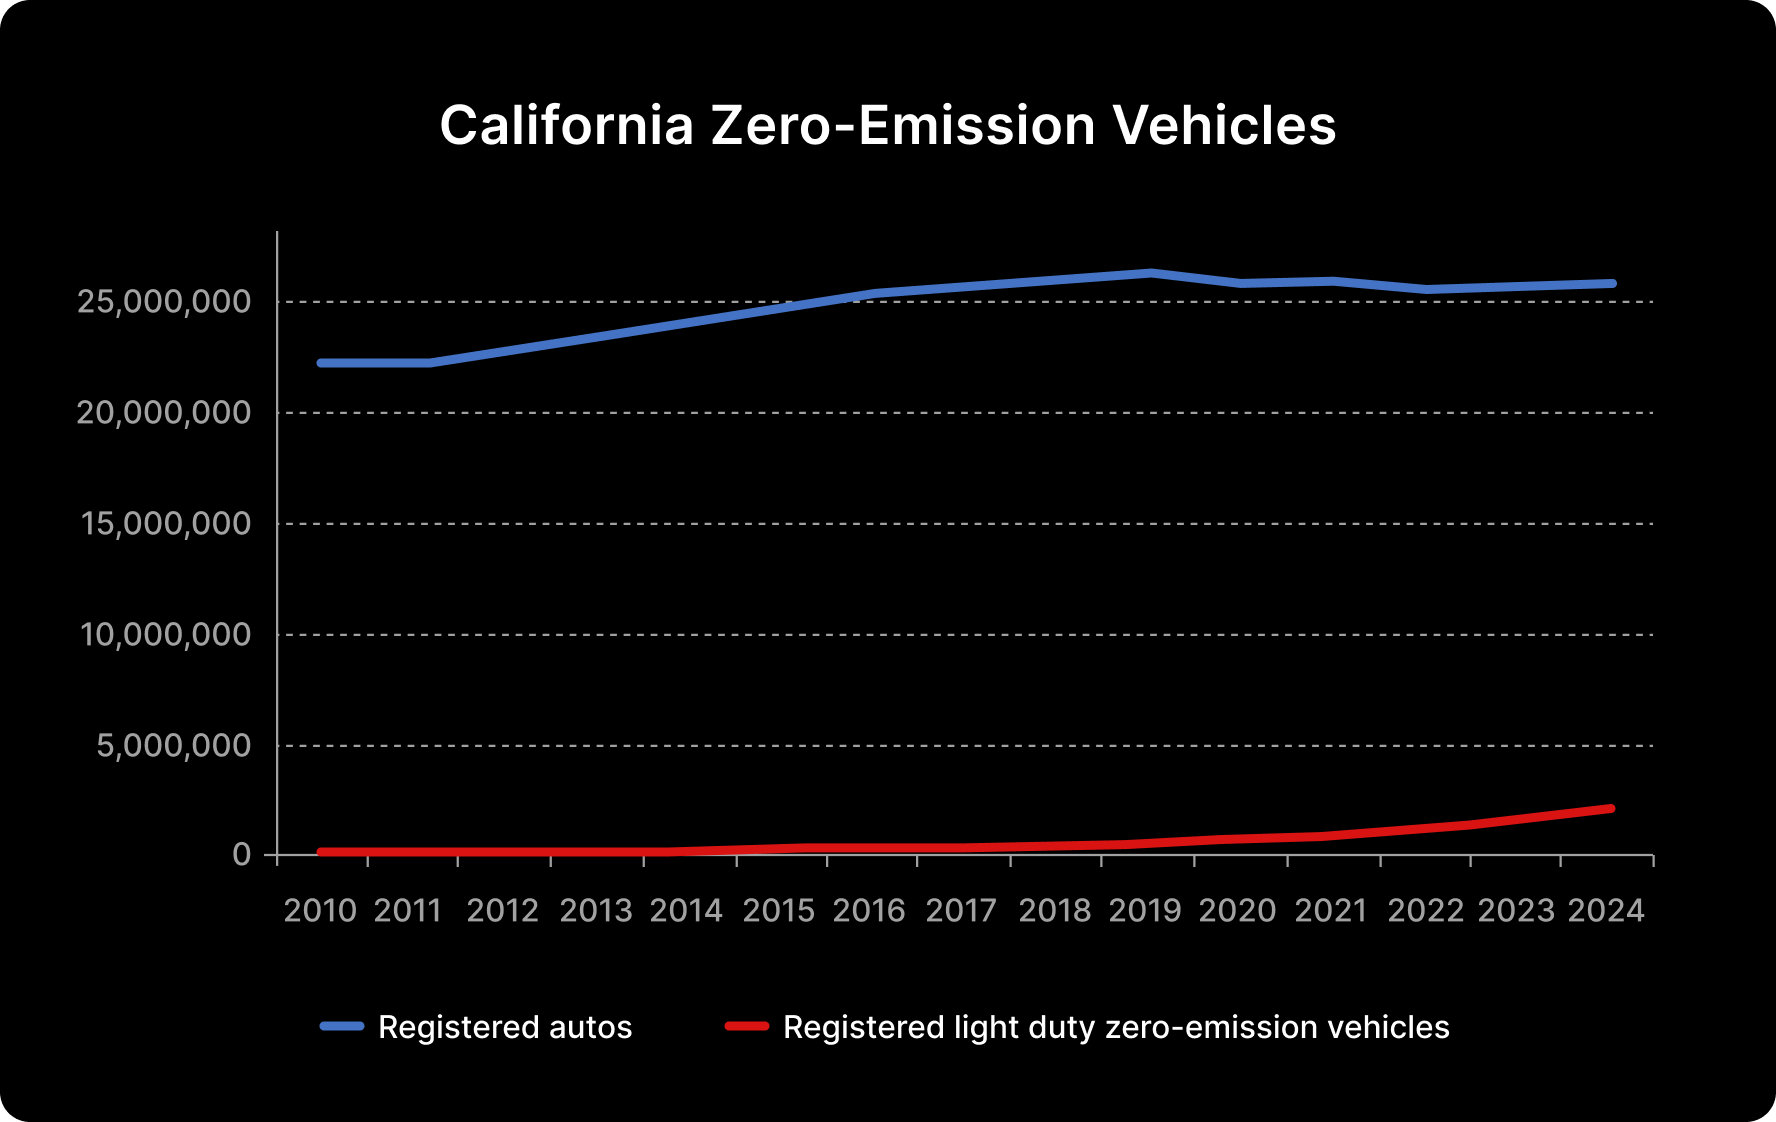
Registrations of zero-emission vehicles (ZEV) in California from 2010 to 2024. These represent all light duty vehicles including: passenger cars, light trucks, vans, and sport utility vehicles with wheelbase less than 121 inches in length. The number of registered ZEVs steadily increased from 768 in 2010 (less than 1% of total auto registrations) to 2,142,390 in 2024 (8.3% of total auto registrations).

Historic annual CO₂ emissions due to fossil fuels and industry for countries grouped by income level from 1750 to 2023. Prior to the Industrial Revolution (1760-1840), worldwide CO₂ emissions were very low and growth in emissions remained slow until the mid-20th century.
Since then, annual CO₂ emissions in most countries have increased in direct relation to their income level, with the exception of high-income countries which began to decrease their emissions in 2007.
In 2023, emissions from upper-middle income countries were 17.57 billion tonnes, high-income countries were 14.02 billion tonnes (down from 16.32 tonnes in 2007), lower-middle income countries were 4.89 billion tonnes, and lower-income countries were 196.58 million tonnes. Total worldwide emissions were 37.79 billion tonnes in 2023.
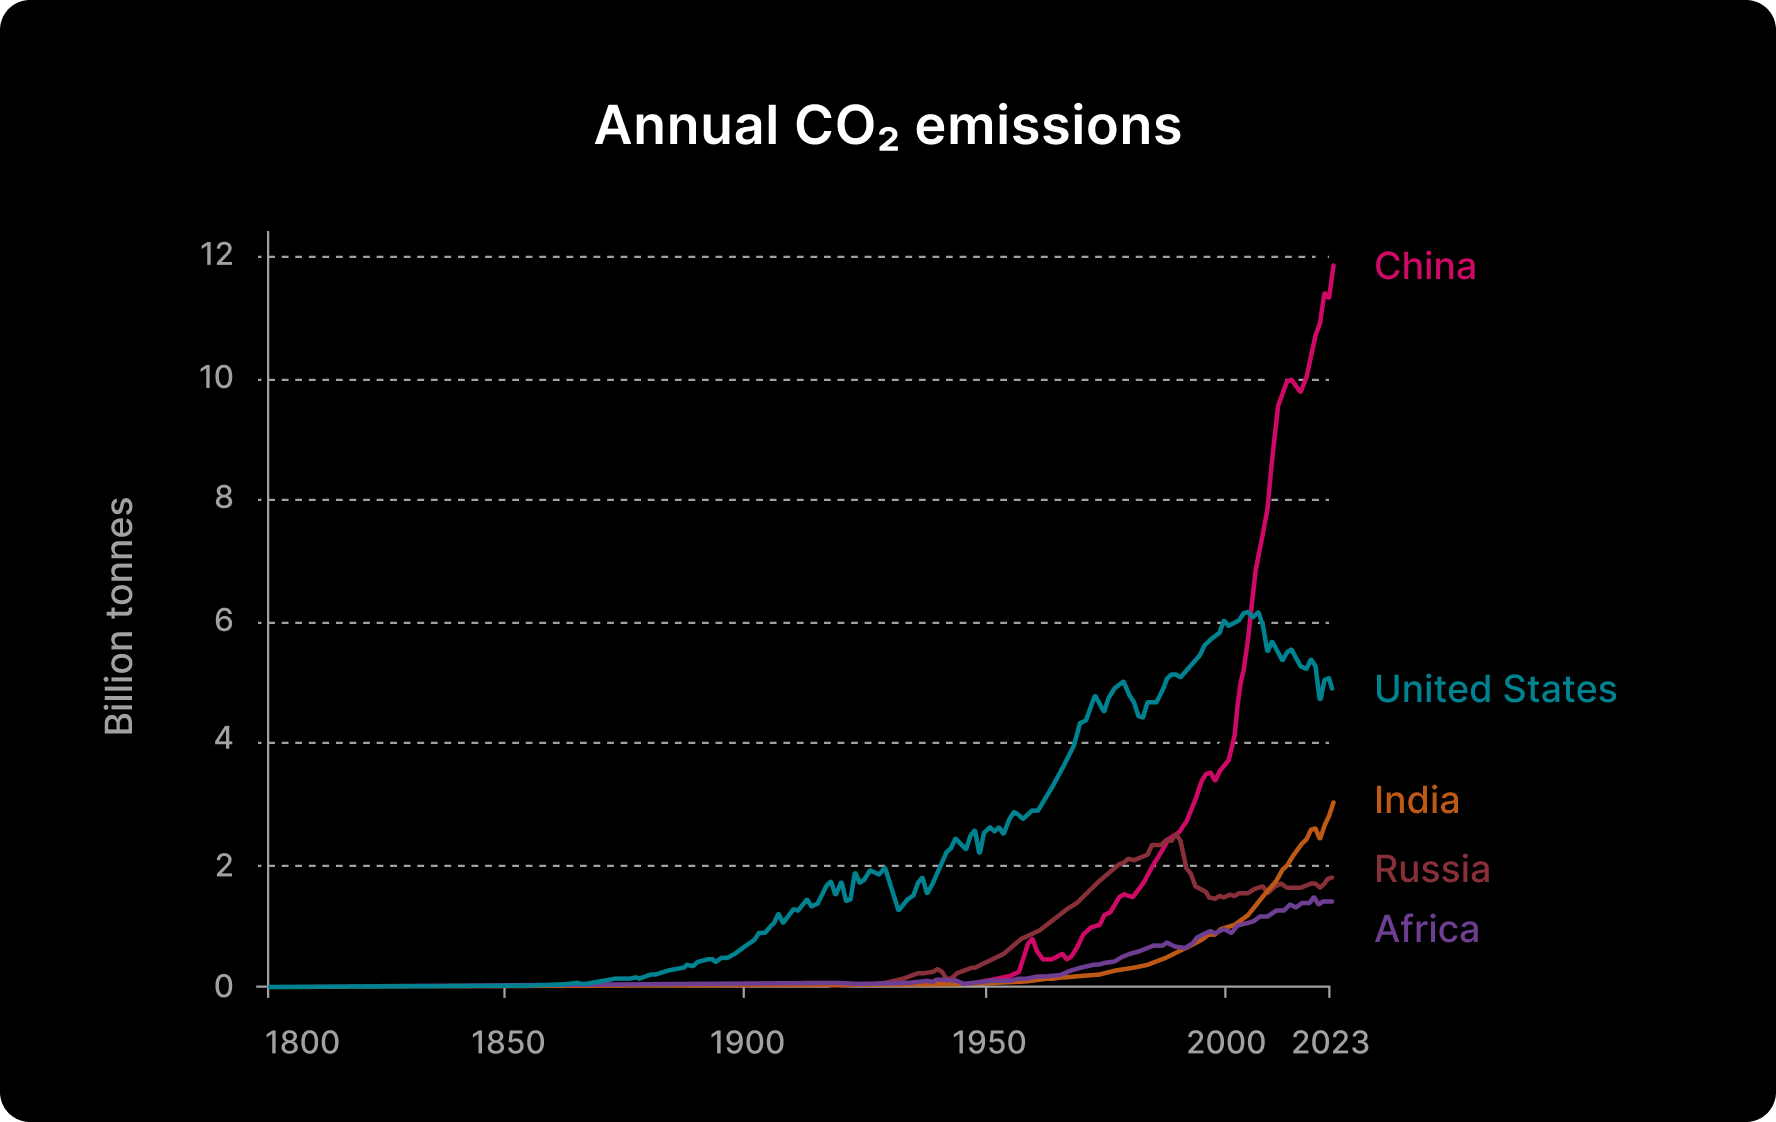
Historic annual CO₂ emissions due to fossil fuels and industry for countries emitting more than 1 billion tonnes CO₂ in 2023 from 1750 to 2023. Included are the countries of China, the United States, India, Russia, and Africa.
Prior to the Industrial Revolution (1760-1840), worldwide CO₂ emissions were very low and growth in emissions remained slow until the mid-20th century. Both the United States and Russia have shown reductions in their emissions since the 1990s.
2023 emissions in the United States were 4.91 billion tonnes (down from its peak of 6.13 billion tonnes in 2005), and in Russia were 1.82 billion tonnes (down from its peak of 2.54 billion tonnes in 1990). China's annual CO₂ emissions surpassed those of Russia and the United States in their peak years and have risen steadily since to 11.9 billion tonnes in 2023.
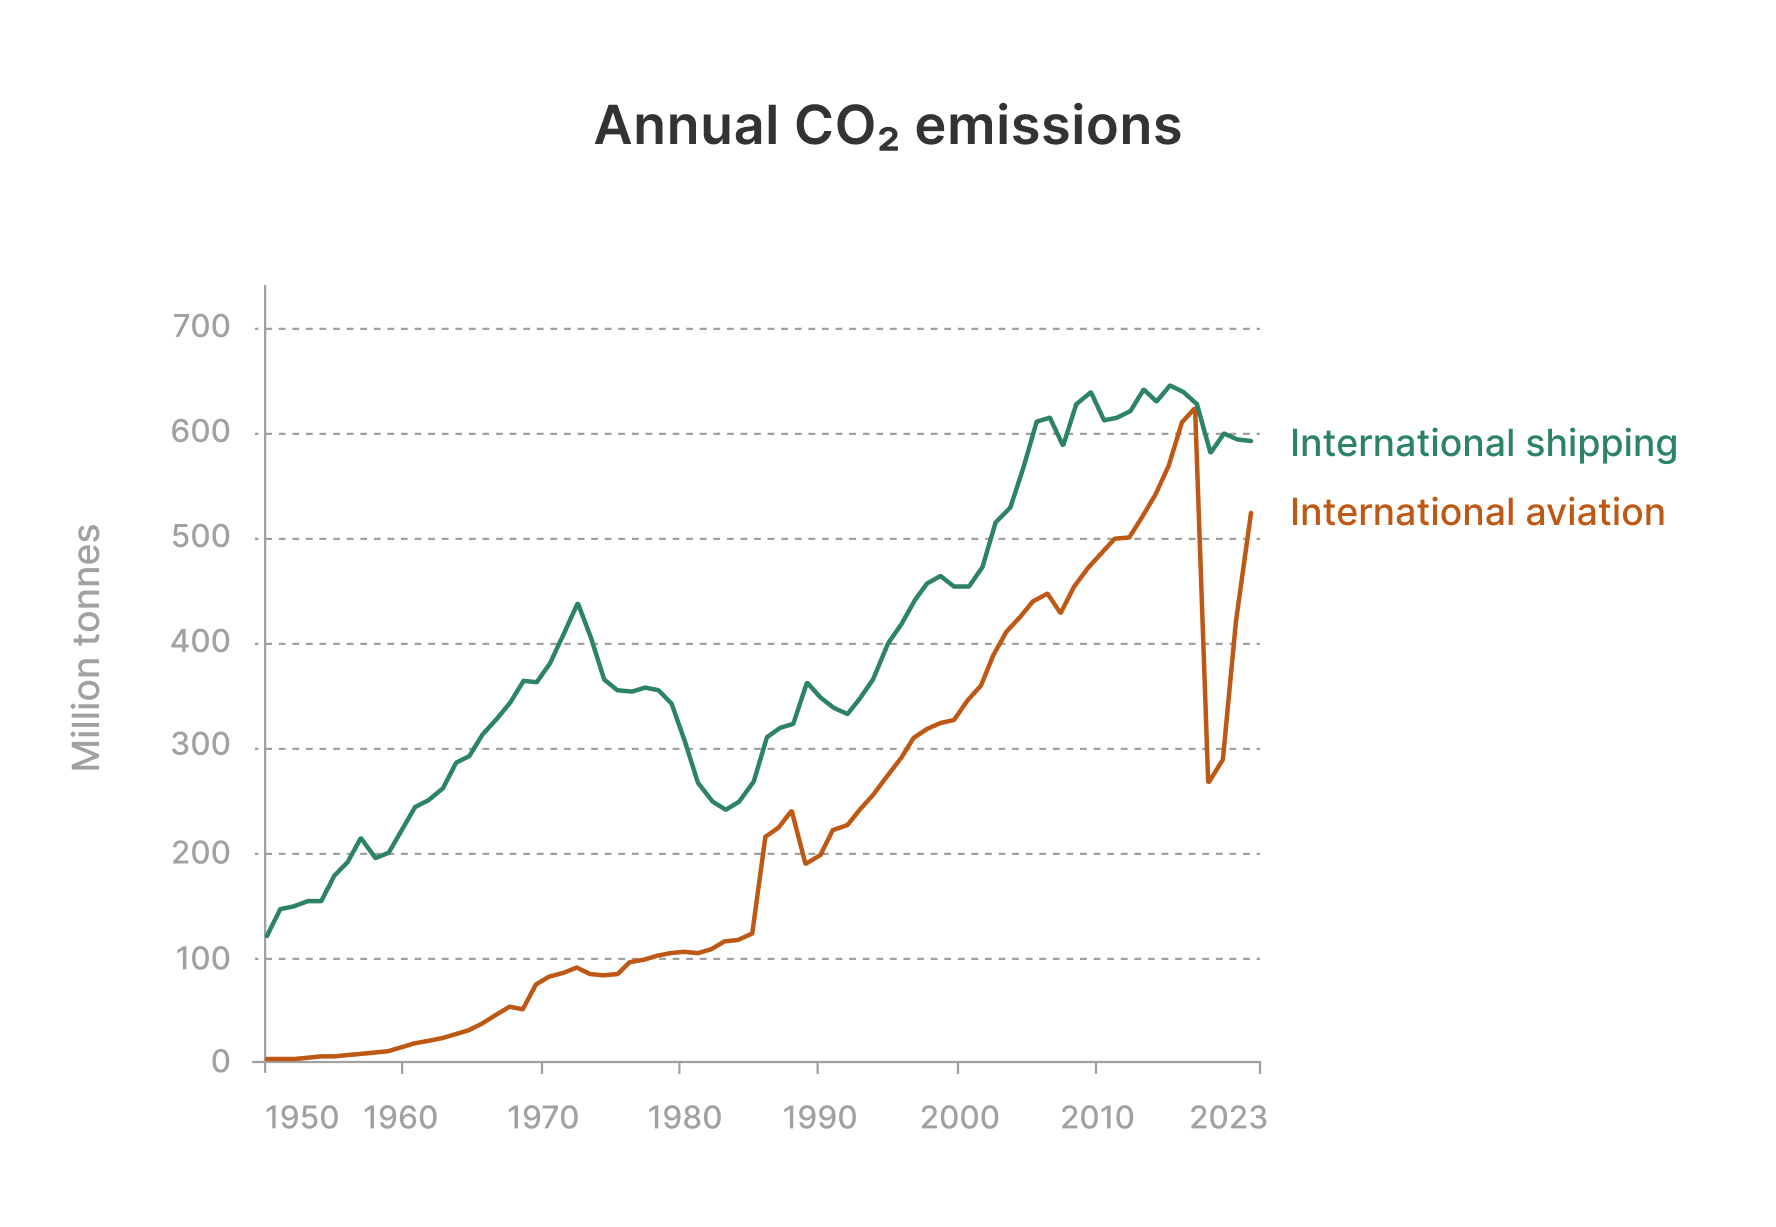
Historic annual CO₂ emissions due to international transportation from 1950 to 2023. Annual emissions from both international shipping and international aviation have increased rapidly since first recorded in the 1950s. International shipping emissions increased from 124.88 million tonnes in 1950, peaking at 645.68 million tonnes in 2017, then decreased to 593.16 million tonnes in 2023. International aviation emissions increased from 3.51 million tonnes in 1950, peaking at 623.61 million tonnes in 2019, then dipped to 270.16 million tonnes during the covid years, and rebounded to 523.41 million tonnes in 2023.
Projected GHG emissions in gigatonnes of CO₂-equivalents for 5 global policy scenarios from 2022 to 2100. Impacts of the following policy scenarios on global temperature-increases above pre-industrial levels are shown:
Uncertainties in projections for each scenario are indicated by their width.
Current policies are projected to reduce global GHG emissions to 2.5 – 2.9° by 2100, but fall short of the 1.5° or 2° required to comply with the Paris Agreement, which was adopted by 196 countries at the UN Climate Change Conference on 12 December 2015. Achievement of the 2022 pledges of all countries to reduce GHG emissions is projected to achieve 2.1° C by 2100.

.png)
Carbon dioxide (CO₂) emissions from burning fossil fuels and from industrial processes such cement and steel production for CY 2023, in tonnes per capita are depicted on the map. Countries emitting more than 10.0 tonnes CO₂ emissions per capita in 2023 are tabulated below:
US crude oil production vs exports from 2005 to 2022 in thousands of barrels (bbl) per day. In 2005, an average of 5,437 thousand bbl of crude oil were produced in the US each day, 983 thousand bbl of which (18%) were exported to other countries. While both the production and exports of crude oil increased steadily in the 2010s, exports increased at a faster rate than production. Coincident with the growth in oil exports, the US government committed to reduce GHG emissions due to the combustion of fossil fuels via the Paris Agreement. Crude oil production peaked in 2020, with a production rate of 13,100 thousand bbl/day, 9,730 thousand bbl/da of which (74%) were exported to other countries. By 2022, crude oil production was 11,600 thousand bbl/da, 7,453 of which (64%) was exported to other countries.

The accounting of the concentration of CO₂ that was either emitted to or removed from earth’s atmosphere as a result of human activities in 2022. The concentration of CO₂ is measured in parts per million (ppm). Ninety percent (36.6 ppm) of the total concentration of emitted CO₂ (40.7 ppm) was due to the combustion of fossil fuels (coal, oil and gas); the remainder (4.4 ppm) to changes to land-uses such as deforestation. The total concentration (23.8 ppm) of CO₂ removed from the atmosphere in 2022 was nearly equally attributed to vegetative uptake by the land and diffusion in the ocean (13.5 ppm and 10.3 ppm, respectively). Because of this removal, only 16.9 ppm (41%) of CO₂ remained in the atmosphere.
The Global Carbon Project is a consortium of more than 50 research institutions around the world which gathers observations and data to update the carbon budget every year.
Global share of new electric cars sold from 2010 to 2022. This includes both full battery-electric and plug-in hybrid vehicles. Although more carbon is emitted during the manufacture of electric vehicles than those with internal combustion engines (ICE), they emit less carbon over their lifetime than their ICE counterparts. In 2010, electric cars made up less than 1% of global car sales, but their market share has grown quickly in many countries since then. By 2022, the percentage of new electric cars sold rose to 88% in Norway, 35% in The Netherlands, 29% in China, 23% in the UK, and 8% in the United States. In 2020 overall, approximately 1 in 7 (14%) of new cars sold globally was electric.


.svg)
