

UTILITIES: Xcel Energy tells Colorado regulators that climate change, wildfire risk and litigation have prompted insurers to increase the utility’s premiums by nearly 400% over last year. (CPR)
ALSO: Wyoming lawmakers look to craft policies to attract more energy-intensive data centers to the state and help utilities deal with associated power demand increases. (WyoFile)
ELECTRIFICATION: A public-private partnership launches a project aimed at decarbonizing a Colorado manufactured-home community by replacing gas appliances with electric ones, bringing in solar power and making other efficiency upgrades. (Utility Dive)
ELECTRIC VEHICLES:
LITHIUM:
POLLUTION: Colorado advocates urge federal regulators to classify the state’s heavily populated Front Range as an “extreme” ozone violator following an abnormally smoggy summer. (CPR)
SOLAR:
CLIMATE:
POLITICS: U.S. Sen. Martin Heinrich, a New Mexico Democrat, touts his support for the SunZia transmission project in a campaign ad, signaling the party’s potential shift toward pushing clean energy infrastructure. (HuffPost)
CLEAN ENERGY: Advocates call on Alaska to tap into its largely unrealized clean energy potential after a report finds the state acquires 2.6% of its electricity from solar, wind and geothermal sources. (Renewable Energy World)
UTILITIES: A new Sierra Club evaluation finds for the fourth year in a row that major U.S. utilities are off track to meet the Biden administration’s emissions reduction goals, and many are in a worse position than last year due to rising demand. (Canary Media)
CLEAN ENERGY:
NUCLEAR: A U.S. Department of Energy report suggests a new serialized approach for designing and building nuclear reactors that would lower upfront costs and meet rising power demand. (Utility Dive)
GRID:
CLIMATE:
ELECTRIC VEHICLES:
OIL & GAS: Natural gas accounted for nearly half of the nation’s energy generation over the summer while coal fell to just 16%, leaving even West Virginia utilities considering a shift to gas. (West Virginia Public Broadcasting)
ELECTRIFICATION: California launches an $80 million program aimed at electrifying low and moderate-income households with rebates for heat pumps, appliances and efficiency upgrades. (Sacramento Bee)
CORRECTION: The owners of the Three Mile Island nuclear plant are seeking a $1.6 billion loan guarantee; an item in yesterday’s newsletter listed the wrong amount.
EMISSIONS: Global natural gas exports are responsible for far more emissions than coal exports, researchers find, concluding there is “no need for LNG as an interim energy source” as countries phase out coal. (The Guardian)
COAL:
NUCLEAR: Regulators and lawmakers should do more to make nuclear reactor licensing more accessible and craft regulations that allow existing reactors to support data centers and hydrogen producers, panelists say during a clean energy conference. (Utility Dive)
EQUITY: A solar technician training course in Boston aims to build a more diverse workforce to accelerate the rate of solar installations and help residents of underserved communities. (WBUR)
POLITICS:
OIL & GAS: ConocoPhillips signs a $300 million deal to acquire some of Chevron’s oil and gas facilities on Alaska’s North Slope, bucking the trend of large companies selling out to private firms. (Alaska Beacon)
CARBON CAPTURE: The U.S. Interior Department is two years behind in crafting rules for offshore carbon sequestration, but expects to finish this year. (E&E News)
HYDROGEN: The U.S. Treasury Department will finalize its clean hydrogen tax credit rules by the end of the year, a deputy secretary says. (Heatmap)
CLIMATE: An investigation finds Oregon-based Nike’s private jets’ greenhouse gas emissions have increased since the company first pledged to reduce its carbon footprint. (Oregonian)
CLEAN ENERGY:
OIL & GAS:
COAL: An international commission considers tighter regulations on Canada coal mines accused of contaminating a river that crosses the border into Idaho. (Idaho Capital Sun)
URANIUM: Arizona’s attorney general calls on federal agencies to update a controversial Grand Canyon-era uranium mine’s decades-old environmental review and apply new science to potential groundwater impacts. (news release)
POLLUTION: California advocates support the San Diego port’s efforts to reduce pollution that disproportionately affects disadvantaged communities, but some say it may be too little too late. (Next City)
WIND: The federal Bureau of Ocean Energy Management finds proposed wind leasing off Oregon’s coast will have no significant environmental impacts. (KOBI 5)
SOLAR:
STORAGE:
COMMENTARY:
CLIMATE: A compilation of government documents shows climate change was discussed in Congress and the media in the 1960s and 1970s, including a Nixon administration report that said “the greatest consequences of air pollution for man’s continued life on earth are its effects on the earth’s climate.” (Grist)
ALSO: The research, compiled by historian Naomi Oreskes, contradicts assertions in recent Supreme Court rulings that climate change was not a topic of concern when the Clean Air Act was passed in 1970. (Inside Climate News)
UTILITIES: Hawaiian Electric and six other entities agree to pay $4 billion in damages to settle lawsuits stemming from last year’s deadly Maui wildfires. (CNN)
ELECTRIFICATION: Nearly $500 million in federal funding will help encourage heat pump adoption in Alaska and New England. (Canary Media)
COAL:
GRID: An Exelon executive says the record-high prices awarded in PJM Interconnection’s latest capacity auction could lead to double-digit rate increases for some of its utilities. (Utility Dive)
ELECTRIC VEHICLES:
SOLAR: Michigan farmers seeking additional revenue through solar leases are backed by a new state law that gives state regulators greater oversight in the event of local opposition. (Bloomberg)
POLITICS:
COMMENTARY: A utility-funded California program relies on innovative approaches to help low-income homeowners take advantage of electric heat pump rebate programs. (CalNEXT, sponsored)
HYDROPOWER: A study finds climate change-exacerbated drought has diminished hydropower production in Western states, leading to billions of dollars in economic losses and increased natural gas generation. (Energy Mix)
SOLAR: A Hawaii cooperative establishes a community-owned solar system aimed at bringing down power prices and achieving energy sovereignty. (Grist)
GRID:
MINING:
UTILITIES:
WIND: West Coast advocates join other groups to form a national coalition aimed at pushing back on offshore wind development. (E&E News, subscription)
BIOFUELS: A northern California nonprofit secures financing for a proposed 5 MW biomass plant that would process forest restoration project waste. (Renewable Energy)
CLIMATE:
CARBON CAPTURE: Calpine enters a cost-share agreement with the U.S. Energy Department to fund a carbon capture demonstration project at a natural gas plant in California. (Power Engineering)
PUBLIC LAND: The federal Bureau of Land Management issues a proposed plan that would guide renewable energy development and oil and gas drilling on 730,000 acres in New Mexico. (news release)
The following commentary was written by Larry Glover, a Maryland-based energy marketing & communications SME. See our commentary guidelines for more information.
This heat wave is only the beginning. As climate disasters and extreme weather events become more frequent, ensuring reliable and affordable access to electricity for all communities has never been more urgent. Places that we typically think of as pleasant in the summer months are becoming heat domes, and many electricity providers remain overwhelmed when their peak energy demand threatens the stability of the entire electric grid.
Clean, distributed, energy resources such as solar and batteries are anchoring our country’s electric grid in the face of extreme summer heat. And while the federal government has a duty here, state policymakers and regulators hold an immense amount of power to pave the way for these clean energy technologies.
Let’s start with the good news. Several states are beginning to realize the need for clean energy – both out of protecting energy users from losing power during extreme weather and as an equitable path forward. I’m heartened to see that Maryland is the latest state to heed those calls to action by enacting key legislation that will tackle this challenge head-on, establishing an equitable path toward a sustainable energy future.
This year, Maryland passed a trio of bills — signed by Gov. Wes Moore — to expand access to solar, stimulate the solar industry and require utilities to leverage distributed energy resources that will ultimately benefit underserved communities, which suffer the most from high-energy burdens and pollution. The Brighter Tomorrow Act directs the Maryland Energy Administration to earmark tens of millions of dollars in the coming years to provide upfront grants for low and moderate-income households across the state to install solar. The Drive Act, encourages utilities to harness these home solar and battery systems into virtual power plants (VPPs), which are networks of connected solar and battery systems that function as a unified power source. Finally, the Empower Act ensures those who invest in home batteries are fairly compensated, allowing people to invest in these resources to take care of their neighbors.
There’s not a one-size-fits-all approach to state policy promoting distributed energy, and other states have taken alternative routes. In Illinois, the Climate and Equitable Jobs Act (CEJA), designed to cut emissions across the state, encouraged a rooftop solar boom since its 2021 passage. Texas is on California’s tail for solar and storage, bolstered by a VPP pilot program approved by ERCOT last year.
Unfortunately, for every state or region moving forward, others are moving back. Cuts to the net-metering program in California have caused the solar industry to contract to 2014 levels, and cost 17,000 jobs. Puerto Rico, a territory that is perhaps most in need of solar and storage as it faces frequent heat waves and hurricanes threatening the electric grid, also has net metering on the chopping block, with hurricane season barely underway. It’s truly mind-boggling.
Through the hottest summer many of us have experienced, every state is grappling with the escalating consequences of climate change. As the White House, rightfully, continues to prioritize environmental justice initiatives, our state governments also have a duty to incentivize and enable clean energy resources. Our grid and our lives depend on it.
Human-caused climate change made the “unprecedented” wildfires that spread across Brazil’s Pantanal wetlands in June 2024 between four and five times more likely, according to a new rapid attribution study.
South America’s Pantanal – the world’s largest tropical wetland – experienced exceptionally hot, dry and windy conditions in June, causing blazes in the region to soar.
The World Weather Attribution (WWA) service finds that the month was the hottest, driest and windiest year in the 45-year record.
The team conducted an attribution study to find the “fingerprint” of climate change on these weather conditions.
They find that, in a world without climate change, these conditions would be very rare – occurring only once every 161 years.
In today’s climate, which has already warmed by 1.2C above pre-industrial temperatures as a result of human-caused warming, these conditions are a one-in-35 year event.
The authors also explore how wildfires in the region could continue to worsen as the planet warms.
They find that if that planet reaches warming levels of 2C, the likelihood of these conditions could double, to once every 18 years.
The vast Pantanal wetland extends across Brazil, Bolivia and Paraguay.
It is one of the most biodiverse places on earth, home to more than 4,700 plant and animal species.
Every year, hot and dry weather conditions make the wetland prone to wildfires – usually between July and September.
By June this year, intense wildfires were already soaring. The number of Pantanal fires increased by 1,500% in the first half of this year compared to the same period in 2023, according to data from Brazil’s National Institute for Space Research reported by the Brasil de Fato newspaper.
This amounts to more than 1.3m hectares of the wetland burned so far this year – an area around eight times the size of London.
Around 2,500 fires were identified in June, which is the highest number since 1998 and more than six times the level reported in 2020, which was “known as the ‘year of flames,’ when wildfires ravaged the area and sparked widespread outcry”, the Associated Press said.
The region is currently experiencing its worst drought in 70 years, which Brazil’s government has said is being “intensified by climate change and one of the strongest El Niño phenomena in history”.
Prolonged dry periods, high temperatures and land-use change all contribute to wildfire conditions, says Dr Maria Lucia Barbosa, a postdoctoral researcher at the Federal University of São Carlos in Brazil, who was not involved in the attribution study. She tells Carbon Brief:
“While fires are a natural part of the Pantanal ecosystem, the recurrence of extreme fire seasons – such as the current one, shortly after the devastating 2020 fires – suggests that, alongside climate change, a new fire regime may be emerging in the ecosystem, characterised by increased severity and frequency.”
Wildfire intensity and duration are influenced by a wide range of factors, including weather, vegetation and fire management strategies.
The authors of the new study focus on a metric called the “daily severity rating” (DSR), which combines information on maximum temperature, humidity, wind speed and precipitation. Dr Clair Barnes – a research associate at Imperial College London’s Grantham Institute and author on the study – told a press briefing that this metric “indicates how difficult it is likely to be to control the fire once it starts”.
High temperatures and wind speeds, as well as low humidity and rainfall, are very conducive to wildfires spreading and, therefore, produce a high DSR.
The map below shows the average DSR in the Pantanal in June 2024. It reveals that most of the Pantanal was experiencing wildfire risk above the 1990-2020 average over that month.
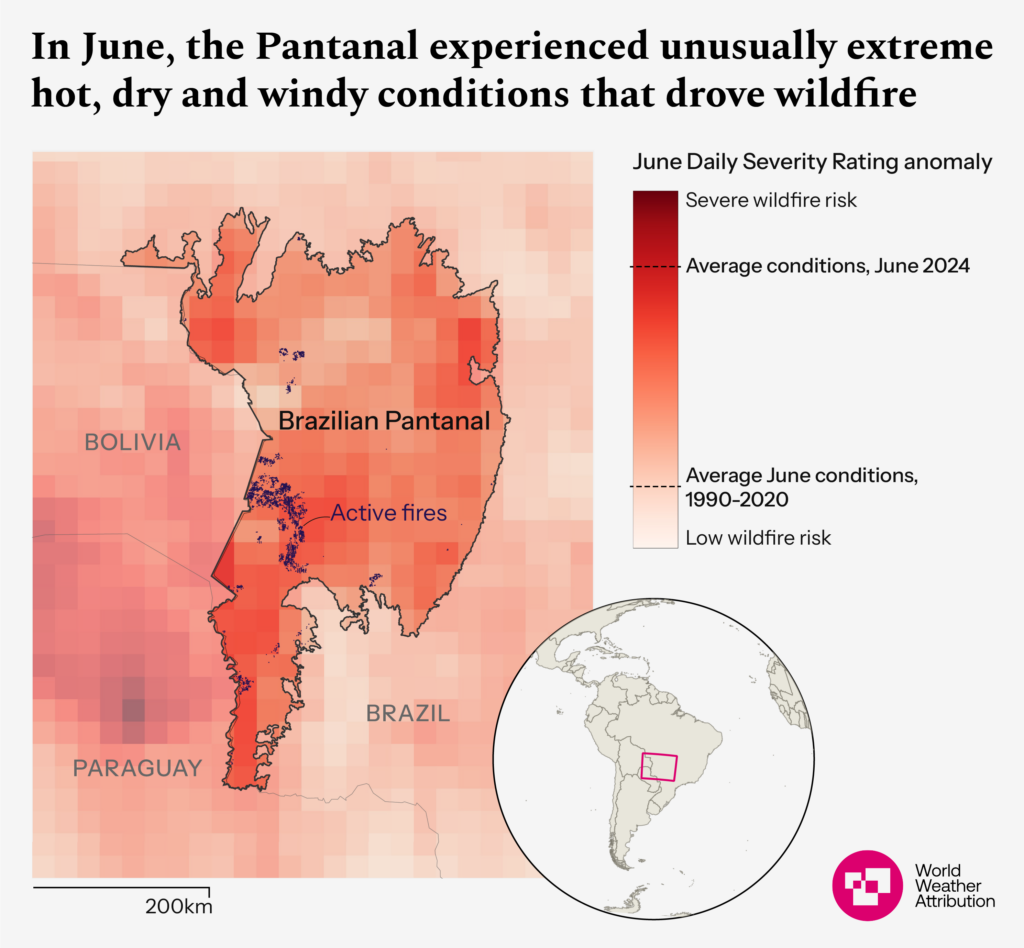
The weather conditions in the Pantanal in June 2024 were “really unusual for the time of year”, Barnes said.
To investigate how atypical the weather conditions in June 2024 were, the authors analysed temperature, windiness, rainfall and humidity data from the past 45 years.
The chart below depicts annual average rainfall and annual average daily maximum temperature in the Pantanal over 1979-2024. It shows that over the past 45 years, the average temperature in the Pantanal has been steadily increasing and total rainfall has been decreasing.
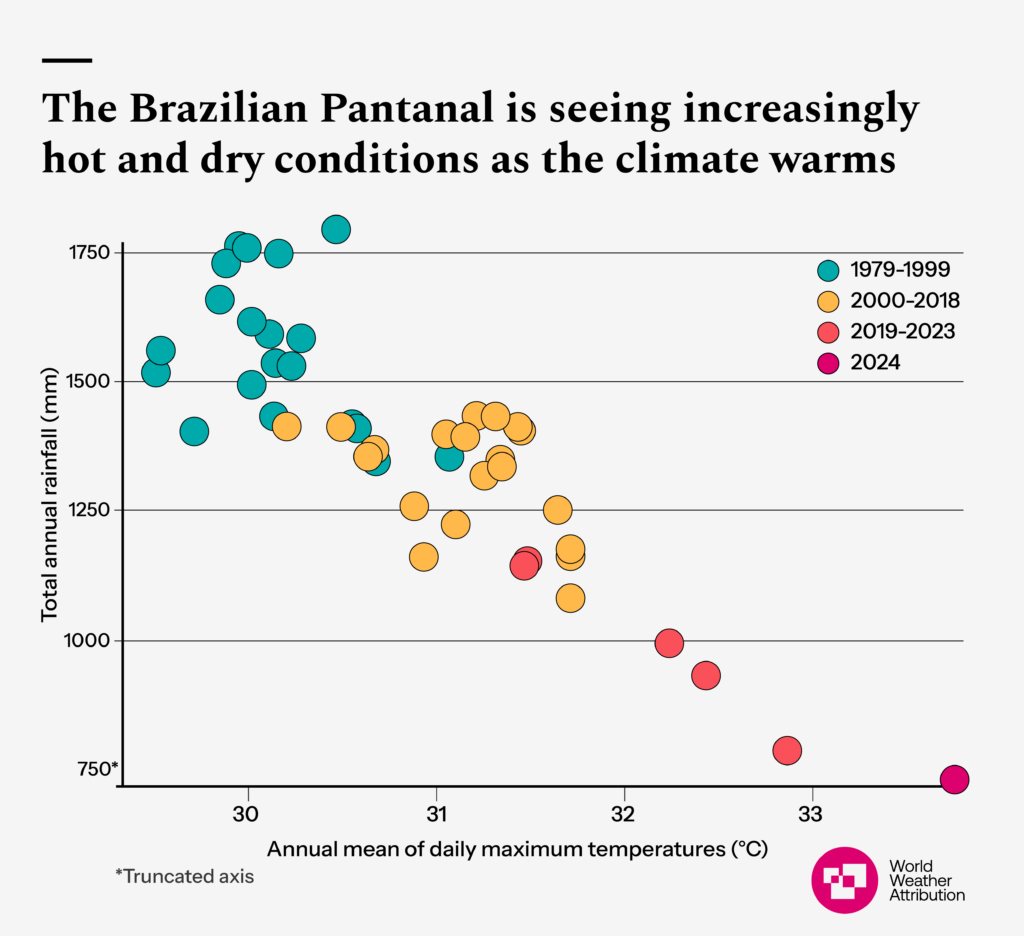
The authors find that June 2024 was the hottest, least rainy and windiest June since records began. They also find that the relative humidity was the second lowest on record.
Annual rainfall across the Pantanal has been decreasing over the past 40 years, the authors note. They point out that natural variability and deforestation are known to impact rainfall patterns across South America, but add that climate change “may also be influencing the drying trend”.
Attribution is a fast-growing field of climate science that aims to identify the “fingerprint” of climate change on extreme-weather events, such as heatwaves and droughts.
To conduct attribution studies, scientists use models to compare the world as it is today to a “counterfactual” world without human-caused climate change. In this study, the authors investigated the impact of climate change on DSR in the Pantanal region.
They find that in today’s climate – which has already warmed by 1.2C as a result of human activity – fire weather conditions like the ones that drove the wildfires in the Brazilian Pantanal during June 2024 are a “relatively rare event”, and would be expected to occur roughly once every 35 years.
However, they say, if the planet continues to warm, these events could become more likely. If the climate warms to 2C above pre-industrial levels, the likelihood of these fire conditions will double compared to today.
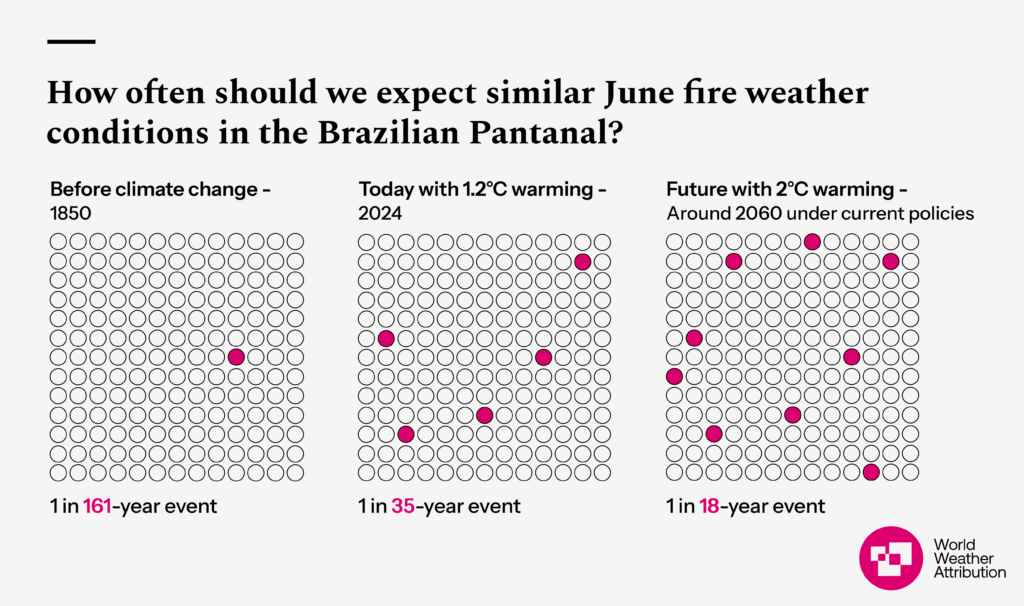
The graphic below shows how often June fire weather conditions, such as those seen in the Brazilian Pantanal in June 2024, could be expected under different warming levels.
The square on the left shows a world without climate change, in which these DSR levels would happen once every 161 years. The middle square shows that in today’s climate, the DSR is a one-in-35 year event. And the square on the right shows that in a 2C world, a June DSR like that of 2024 could be expected once every 18 years.
The authors also investigate how climate change affected DSR “intensity”. They find that human-induced warming from burning fossil fuels increased the June 2024 DSR by about 40%.
The authors add that as the climate continues to warm, this trend is likely to worsen. The authors warn that if warming reaches 2C above pre-industrial temperatures, similar June fire weather conditions will become 17% “more impactful”.
(These findings are yet to be published in a peer-reviewed journal. However, the methods used in the analysis have been published in previous attribution studies.)
Wildfires have wide-ranging impacts on people and nature in the Pantanal. In one example, a 2021 study found that around 17m vertebrates were “killed immediately” by the fires in 2020.
Wildfires can “devastate [the] livelihoods” of people living in the Pantanal and “pose significant health risks” from the resulting smoke, Barbosa says.
She notes that wildfires release CO2 into the atmosphere, contributing to climate change, and they “lead to widespread loss of habitat, endanger wildlife and disrupt ecological balances”. She tells Carbon Brief:
“Species that are already threatened or have limited ranges are particularly vulnerable to habitat destruction caused by fires.
“Repeated fires can push fire-sensitive vegetation into a state of permanent degradation, further threatening the ecological integrity of the region.”
Some fires are permitted for agricultural purposes – such as to burn degraded pasture – during the rainy season, from around November to April. This practice is banned in the drier summer months, but a 2020 piece from Mongabay notes that “in reality, the ban is not always respected and enforcement is haphazard”.
Filippe Santos, a researcher at Portugal’s University of Évora and one of the authors of the study, told a press briefing that “fire is part of the dynamics” of the Pantanal – when it is controlled.
Low-intensity fires allow animals “time to leave” the area, he said, adding:
“What we see with wildfires, is that this does not happen, because the fire is so intense and on such a large scale that animals don’t have time to run away.”
The “highly intense” wildfires also “don’t give nature enough time to recover”, Santos says.
In June, Brazil’s environment minister, Marina Silva, told the government news agency Agencia Brasil that the country is “facing one of the worst situations ever seen in the Pantanal”, adding that the fires are heightened by climate extremes and criminal activities.
Most Pantanal fires are caused by human activity, a 2022 study found. Police in Brazil are investigating the “possible culprits” behind 18 fire outbreaks in the region, Silva said last month.
In recent weeks, a law to improve coordination on tackling fires took effect in Brazil.
A statement from the Institute for Society, Population and Nature, a Brazilian NGO, says this new policy is a “significant milestone” and will establish “guidelines for the practice of integrated fire management across all biomes and territories in the country”.
Barbosa says it will be a “challenge” to implement this policy. She would like to see a “comprehensive national early warning system for multiple hazards to ensure risk reduction” for a range of threats – including wildfires. She tells Carbon Brief:
“Collaboration with local communities, firefighters and brigades is crucial for prevention and response efforts…A coordinated approach that integrates all stakeholders, along with the establishment of a national fund dedicated to fire management, is essential for mitigating the impacts of future fire seasons.”
The UN chief on Thursday issued an urgent call to action to better protect billions around the world exposed to crippling effects of extreme heat, as global temperature rise continues unabated.
The appeal comes against the backdrop of record temperatures and deadly heatwaves – from the United States to Africa’s Sahel and Europe to the Middle East – that have killed several hundred people this summer.
During the Hajj, for instance, scorching heat claimed over 1,300 pilgrim lives.
“Billions of people are facing an extreme heat epidemic – wilting under increasingly deadly heatwaves, with temperatures topping 50 degrees Celsius around the world. That is 122 degrees Fahrenheit – halfway to boiling,” Secretary-General António Guterres said at a press conference at UN Headquarters in New York.
“The message is clear: the heat is on. Extreme heat is having an extreme impact on people and planet. The world must rise to the challenge of rising temperatures.”
The UN chief highlighted that while “crippling heat is everywhere”, it does not affect everyone equally.
Those most at risk include the urban poor, pregnant women, children, older persons, those with disabilities, the sick, and the displaced, who often live in substandard housing without access to cooling.
According to UN estimates, heat-related deaths for people over 65 years of age increased by about 85 per cent over the past two decades, while 25 per cent of all children today are exposed to frequent heatwaves and by 2050, that could rise to almost 100 per cent.
“We must respond by massively increasing access to low-carbon cooling, expanding passive cooling – such as natural solutions and urban design and cleaning up cooling technologies while boosting their efficiency,” Mr. Guterres said, calling for scaling up of finances to protect communities from “climate chaos”.
Mr. Guterres also underscored the need to step up protections for workers.
Over 70 per cent of the global workforce, or 2.4 billion people, are at substantial risk of extreme heat, according to new report from the UN International Labour Organization (ILO).
The situation is particularly dire in the Africa and Arab regions, where more than 90 per cent and 80 per cent of workers are exposed, respectively. In Asia and the Pacific – the world’s most populous region – that figure is three in four workers (75 per cent).
In addition, heat stress at work is projected to cost the global economy $2.4 trillion by 2030, up from $280 billion in the mid-1990s.
“We need measures to protect workers, grounded in human rights,” Mr. Guterres stressed.
“And we must ensure that laws and regulations reflect the reality of extreme heat today – and are enforced.”
He also underscored the need to strengthen resilience of economies and societies, citing impacts such as infrastructure damage, crop failures, and increased pressure on water supplies, health systems, and electricity grids.
Cities are particularly vulnerable, experiencing heating at twice the global average rate.
To address these challenges, Mr. Guterres called for comprehensive and tailored action plans based on scientific data are essential for countries, cities and sectors.
“We need a concerted effort to heatproof economies, critical sectors and the built environment.”
The UN chief reiterated that it is crucial to recognize the myriad symptoms beyond extreme heat, such as hurricanes, floods, droughts, wildfires and rising sea levels.
The core issue is the reliance on fossil fuels and climate inaction, he stated, stressing that governments, especially G20 nations, the private sector, cities and regions, must urgently adopt climate action plans to limit global temperature rise to 1.5°C.
Alongside, countries must urgently phase-out fossil fuels and end new coal projects.
“They must act as though our future depends on it – because it does.”
Watch: Extreme Heat: UN Secretary-General's Call to Action | United Nations by United Nations.
Last month saw another extreme weather milestone with the world’s hottest day on recent record registered on 22 July – yet another indication of the extent to which greenhouse gas emissions from human activities are changing our climate, the World Meteorological Organization (WMO) reported on Wednesday.
Global average temperatures for 13 consecutive months from June 2023 to June 2024 also set new monthly records.
“Widespread, intense and extended heat waves have hit every continent in the past year. At least ten countries have recorded daily temperatures of more than 50 degrees Celsius in more than one location,” said WMO Secretary-General Celeste Saulo.
These trends underline the urgency of the Call to Action on Extreme Heat, a new initiative launched in July by UN Secretary-General António Guterres to enhance international cooperation to address extreme heat.
“Earth is becoming hotter and more dangerous for everyone, everywhere,” stressed the UN Chief.
Extreme heat is causing a ripple effect felt right across society.
An annual 1℃ increase in temperature leads to a 9.1 per cent increase in poverty. Moreover, 12 per cent of all food produced is lost due to a lack of cooling and working hours equivalent to 80 million full-time jobs could be lost due to heat stress by 2030.
The consequences have become deathly. Nearly half a million heat-related deaths occurred each year from 2000 to 2019.
Taken together, extreme heat is tearing through economies, widening inequalities, and derailing the future of the Sustainable Development Goals.
“This is becoming too hot to handle,” said Ms. Saulo.
Listen to: ‘Heatwaves will be more frequent because of human-made climate change’ by United Nations News.
The UN chief launched the Call to Action to mitigate the dire environmental and socioeconomic consequences that are already evident.
The initiative emphasises the need for concerted effort in four critical areas: caring for the vulnerable, protecting workers, boosting resilience of economies and societies using data and science, and limiting temperature rise to 1.5℃ by phasing out fossil fuels and scaling up investment in renewable energy.
It brings together the expertise and perspectives of ten specialised UN entities, underscoring the diverse multi-sectoral impacts of extreme heat on human health, lives, and livelihoods.
“The WMO community is committed to responding to the UN Secretary-General’s Call to Action with better heat-health early warnings and action plans,” said Ms. Saulo, adding that recent estimates indicate that the global scale-up of heat health-warning systems for 57 countries alone has the potential to save around 98,000 lives per year.

.svg)
