

01 Electricity demand saw the third-largest absolute increase ever in 2024
02 China’s per capita electricity use overtook France’s for the first time in 2024, and was five times that of India’s
03 A fifth of the demand increase in 2024 was due to the impacts of hotter temperatures compared to 2023
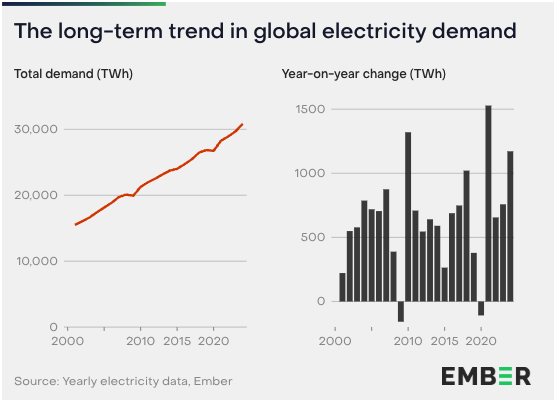
Global electricity demand increased by 4% (+1,172 TWh) in 2024. This was the third-largest absolute increase in electricity demand ever, only surpassed by rebounds in demand in 2010 from the global recession and in 2021 from the Covid-19 pandemic. This increase is significantly above the average annual demand growth of 2.5% in the previous ten years (2014-2023).
Global electricity demand rose to 30,856 TWh, crossing 30,000 TWh for the first time. Since the turn of the century, electricity demand has doubled.
Some of the exceptional growth in 2024 was due to weather conditions. As explored in chapter 1, we calculate that hotter temperatures added 0.7% to global demand in 2024. Nonetheless, emerging drivers of electricity demand such as electric vehicles (EVs), data centres and heat pumps also added 0.7% to global demand growth in 2024 (+195 TWh), a slight step up from the 0.6% they added in 2023 (+174 TWh). See more in chapter 2.2.
China recorded the largest increase in electricity demand, adding 623 TWh (+6.6%), which accounted for more than half of the global increase. The US saw a rise of 128 TWh (+3%). India’s demand increased by 98 TWh (+5%). As recent Ember analysis shows, all three countries experienced heatwaves that drove up electricity demand beyond increases due to economic activity.
Other countries with substantial increases were Brazil (+35 TWh, +4.9%), Russia (+32 TWh, +2.8%), Viet Nam (+26 TWh, +9.5%) and Türkiye (+18 TWh, +5.6%).
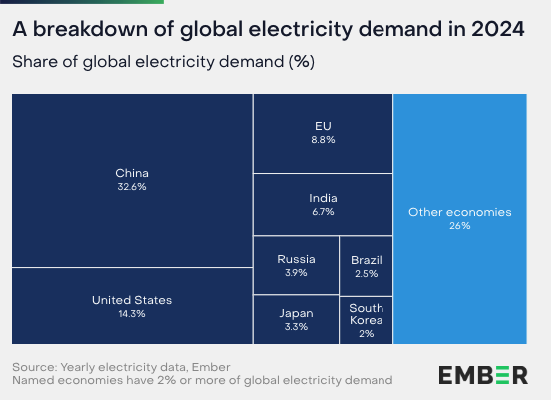
China’s share of global electricity demand has increased due to its continued demand growth above the world average. With 10,066 TWh, China’s electricity demand contributed roughly a third (32.6%) of the global total, up from 28% five years ago.
China’s global share of demand was more than double that of the US at 4,401 TWh (14.3% of the global total). The EU made up 8.8% (2,727 TWh) of global electricity demand. India’s electricity demand reached 2,054 TWh (6.7% of global demand).
26% of global electricity demand comes from economies that each contribute less than 2%.

Among the top ten electricity consumers, the difference in per capita consumption remained vast. Canada had the highest per capita demand for electricity at 15.5 megawatt hours (MWh). This was more than 10 times higher than India, which places last among this group at 1.4 MWh.
China’s per capita demand (7.1 MWh) was almost double the world average of 3.8 MWh, overtaking France in 2024 and Germany in 2023.

Asia’s electricity demand has grown fourfold since the turn of the century from 4,199 TWh in 2000 to 16,153 TWh in 2024 (+285%), driven by demand increases in China, and increasingly India, Indonesia, Viet Nam and other fast-growing economies.
This trend was not replicated elsewhere. Demand outside Asia grew by just 3,624 TWh (+33%) over the same period, from 11,079 TWh to 14,703 TWh.
Despite moderate increases in the past decade, the entire continent of Africa accounted for just 3.1% of total global electricity demand in 2024, less than Japan.
01 Low-carbon sources surpassed 40% of global electricity generation, driven by record renewables growth
02 Global solar generation has doubled in three years, continuing its pattern of exponential growth
03 Wind and solar have met more than half of global growth in electricity demand since 2015

In 2024, low-carbon power sources rose to 40.9% of global electricity generation, the highest level since the 1940s when hydro generation alone met over 40%.
Solar and wind power are the fastest-growing sources of electricity. Combined, they accounted for 15% of global electricity in 2024, with solar contributing 6.9% and wind 8.1%. The two sources combined now produce more electricity than hydropower at 14.3%. They already surpassed nuclear generation in 2021, which continues to reduce in share (9% in 2024). The rise in wind and solar power over recent years has been remarkable, with solar in particular maintaining rapid growth rates despite reaching high levels of absolute generation. Solar power has doubled in the three years since 2021, continuing its pattern of exponential growth.
The share of fossil sources declined to 59.1% in 2024, despite increases in absolute generation. It has declined substantially since the peak of 68.3% in 2007 and is set to fall further in the coming years as renewable generation growth continues to accelerate. The share of coal generation has fallen significantly, from 40.8% in 2007 to 34.4% in 2024, with more consistent falls in the last 10 years. The share of gas generation has fallen for four consecutive years since it peaked in 2020 at 23.9%, reaching 22% in 2024.
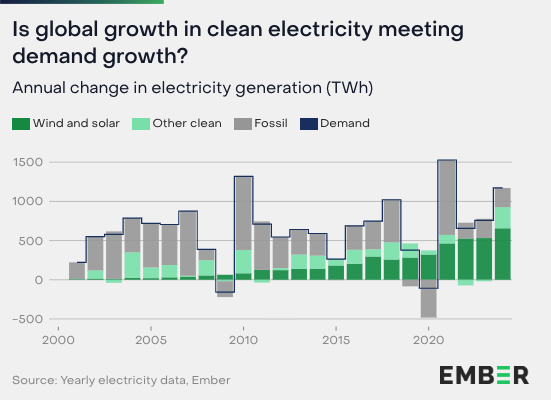
Clean generation met 79% of the increase in global electricity demand in 2024. Electricity generation from clean sources grew by 927 TWh (+7.9%), the largest increase ever recorded. The clean generation increase in 2024 would have been large enough to meet the rise in electricity demand in all but three years in the last two decades.
However, heatwaves in 2024 elevated cooling demand, which was the main driver of a small 1.4% increase in fossil generation (+245 TWh), similar to the rise in the previous two years. Without the impact of hotter temperatures, fossil generation would have remained flat.
Renewables growth alone met 73% of the increase in electricity demand. In total, renewable power sources added a record 858 TWh of generation in 2024, 49% more than the previous record set in 2022 of 577 TWh.
Solar dominated the growth in electricity generation as it was the largest source of new electricity for the third year in a row. Solar added 474 TWh (+29%) in 2024. Solar’s increase alone met 40% of global electricity demand growth in 2024. Wind growth remained more moderate (+182 TWh, +7.9%), with lower wind speeds in some geographies leading to the lowest increase in wind generation in four years despite continued capacity additions. Hydro generation rebounded in 2024 (+182 TWh) as drought conditions in 2023 eased, particularly in China.
Nuclear generation increased by 69 TWh (+2.5%), mostly as a result of less downtime for reactors in France as well as small increases from new reactors in China.
The global increase in fossil generation came mostly from coal which rose by 149 TWh (+1.4%). Gas generation increased by 103 TWh (+1.6%). Other fossil fuels saw a minor fall of 7.7 TWh (-0.9%).
China and India saw the largest increases in coal generation in 2024, together totalling more than the global net increase. The gas generation growth in the US alone (+59 TWh, +3.3%) was equivalent to 57% of the global increase. Gas generation in the US is rising mainly as a result of coal-to-gas switching. Ember’s analysis shows that heatwaves also played a role in raising fossil generation in China, India and the US in 2024.
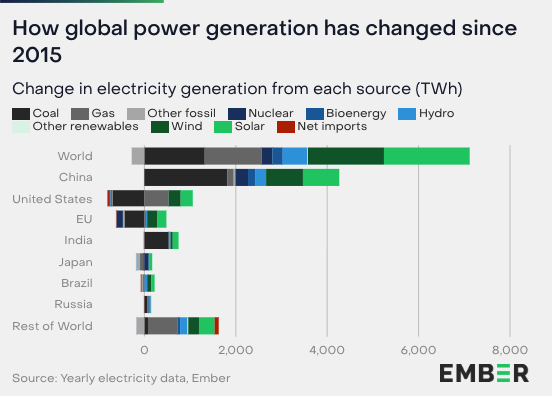
Since 2015, solar and wind have been the two largest-growing sources of electricity, meeting more than half (52%) of global demand growth. Solar generation has grown eightfold since 2015, from 256 TWh in 2015 to 2,131 TWh in 2024. Wind generation tripled from 830 TWh in 2015 to 2,494 TWh in 2024.
China has dominated changes in the global electricity system since 2015, recording the largest increases of any country for solar, wind, hydro, nuclear and coal. China accounts for 45% of global growth in wind and solar generation since 2015. At the same time, global coal generation would have fallen since 2015 without the increase in China.
India saw the second-largest increase in coal generation behind China. India’s rise in coal generation was equivalent to 40% of the global increase in coal since 2015.
The US was responsible for 43% of the global increase in gas generation since 2015. Its gas generation increased by 40% (+531 TWh) over the same period.
01 Power sector emissions hit a new record high as heatwaves drove a small rise in fossil generation
02 Carbon intensity fell by 15% since its peak in 2007, driven by clean generation growing faster than fossil generation
03 Africa and Latin America each make up less than 4% of global power sector emissions, despite representing 19% and 8% of the global population respectively
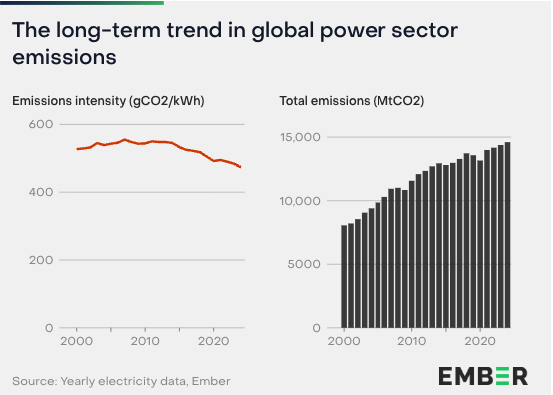
Global power sector emissions reached a new record high in 2024, rising by 1.6% or 223 million tonnes of CO2 (MtCO2), compared to 2023. This increase was similar to 2023 (+1.5%) and 2022 (+1.3%) and was driven by an increase in fossil generation, predominantly from coal. However, without the impact of 2024’s heatwaves, fossil generation would only have risen by 0.2% from 2023, and power sector emissions would have remained almost unchanged (see Chapter 1).
Despite the overall increase in power sector emissions, the emissions intensity (emissions per unit of electricity produced) of global power generation continued to decrease. Emissions intensity dropped by 2.3% to 473 grams of CO2 per kilowatt hour (gCO2/kWh), down from 484 gCO2/kWh in 2023. Emissions intensity has now fallen in nine of the last ten years, with the only increase occurring in 2021 as fossil generation rebounded following large falls in demand during the Covid-19 pandemic.
The decline in emissions intensity is driven by the growing share of clean power in the mix, which reached 40.9% in 2024. As of 2024, the emissions intensity of the global power sector has fallen by 15% since the peak of 555 gCO2/kWh in 2007.
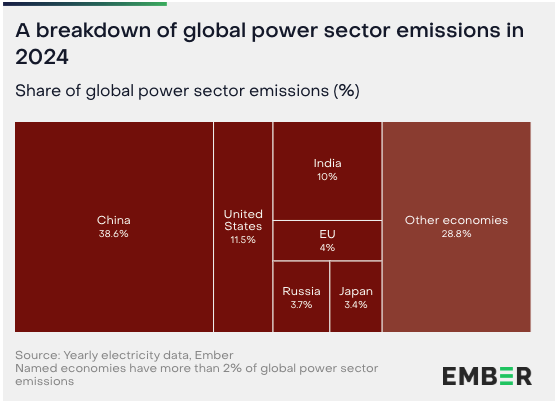
China’s size and reliance on coal generation kept it as the world’s highest power sector emitter in 2024, with emissions reaching 5,640 MtCO2, four times those of the US and India.
Emissions from power generation in the US amounted to 1,683 MtCO2, accounting for 11.5% of the global total. India’s power sector emissions reached 1,457 MtCO2, now close to matching the US and reaching 10% of global power sector emissions for the first time.
China accounted for 38.6% of global power sector emissions – more than the US, India, the EU, Russia and Japan combined. Countries individually producing less than 2% of global power sector emissions made up the remaining 28.8% of the global total.

India and China had the highest emissions intensity of electricity production among the top ten electricity consumers. India’s emissions intensity remained particularly high at 708 gCO2/kWh, compared to the global average of 473 gCO2/kWh. However, India’s emissions intensity has been falling as clean generation has been growing faster than coal.
Canada, Brazil and France had the lowest emissions intensity due to their high shares of low-carbon generation from hydro and nuclear, along with a growing share of wind and solar.
Despite this, Canada’s emissions per capita (2.8 tCO2) were nearly three times larger than India’s (1 tCO2), driven by substantially higher per capita demand for electricity.
South Korea (5 tCO2) and the US (4.9 tCO2) had the highest power sector emissions per capita among the ten biggest electricity consumers due to a combination of high per capita electricity demand and a high share of fossil generation in the mix. China’s emissions per capita have risen to match Japan’s at 4 tCO2.
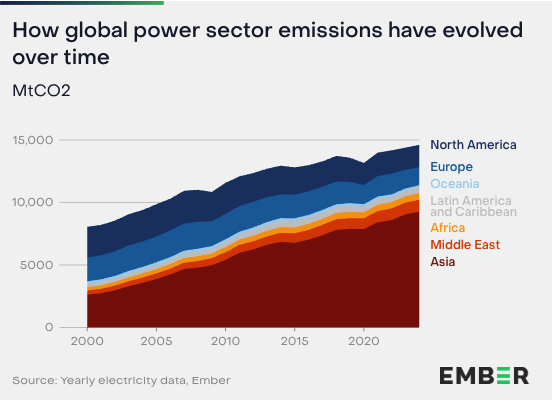
Driven by rapidly growing electricity demand in Asian economies, Asia’s share of global power sector emissions has surged over the last two decades. In 2000, Asia made up a third (33%) of global power sector emissions. In 2024, this had risen to nearly two-thirds (63%).
Power sector emissions in North America and Europe have both fallen by a third since peaking in 2007. Within Europe, EU power sector emissions have halved (-52%) since 2007, whilst emissions in Russia and Türkiye have risen. In the Middle East, emissions have risen more sharply, driven by growing electricity demand in large markets such as Saudi Arabia and Iran, where fossil fuels dominate the electricity mix.
In 2024, African countries still only made up 3.6% of global power sector emissions, despite accounting for 19% of the world’s population. Similarly, Latin America and the Caribbean contributed just 3.2% of global power sector emissions while representing 8% of the global population.

.svg)
